All of the DisplayMate Display Performance Grades,
Ratings and Awards are based entirely on the extensive objective Lab tests and
measurements that we also publish, so that everyone can judge and compare the
display performance data for themselves as well.
|
Categories
|
vivo X
Note
|
Comments
|
|
Display Technology
|
Flexible
OLED Display
with Diamond
Pixels
7.0 inch
Diagonal / 17.8 cm Diagonal
Excluding the Rounded
Corners
|
Flexible Organic Light Emitting Diode
Diamond
Pixels
with Diagonal Sub-Pixel Symmetry.
|
|
Screen Aspect Ratio
|
19.25 : 9 =
2.14
Higher
Aspect Ratio
Most
Smartphones and Widescreen TVs have 16 : 9 = 1.78
|
Height to Width Aspect Ratio
The X Note display screen is 20% longer
than
most Smartphones and widescreen 16:9 TV
content.
|
|
Screen Size
|
2.97
x 6.35 inches
7.54 x
16.13 cm
|
Display Width and Height in inches and
cm.
|
|
Screen Area
|
18.9 square
inches / 122 square cm
After
Subtracting the Camera Opening but not the Rounded Corners
|
A better measure of size than the
Diagonal.
|
|
Front Camera Opening Size
|
Front
Camera Opening has less than 0.1 percent of the Screen Area
Diameter
is 0.14 inches / 3.6 mm
|
Front Camera Opening is by the Top Center
of the Screen.
|
|
Supported Color Gamuts
|
Standard mode – Color Management with Bluer White Point
Bright
mode – Native OLED Color Gamut with Higher Contrast
Professional mode –
sRGB and DCI-P3 Standard Color Gamuts
Automatic
Color Management for Content with ICC Color Profiles
|
The X Note supports 2 Standard Color Gamuts:
sRGB and the new wider DCI-P3 Color
Gamut that
is used in 4K Ultra HD TV content.
|
|
Display Refresh Rates
|
Display
Refresh Frames Per Second FPS
Normal FPS:
60 Hz Refresh
High FPS:
120 Hz Refresh for Smoother Scrolling and Motion
|
Higher Refresh Rates improve image
Scrolling
plus Video and Motion Performance in
Apps,
and may reduce Screen Flicker that some
people experience.
|
|
Display Resolution
|
3080 x 1440
pixels
3K Quad
HD+
|
Screen Pixel Resolution.
Quad HD can display four 1280x720 HD
images.
|
|
Total Number of Pixels
|
4.4 Mega
Pixels
|
Total Number of Display Pixels.
|
|
Pixels Per Inch PPI
|
485 PPI
with Diamond Pixels
Excellent
|
Sharpness depends on the viewing distance
and PPI.
See this on
the visual acuity for a true Retina Display
|
|
Sub-Pixels Per Inch SPPI
|
Red
343 SPPI
Green
485 SPPI
Blue
343 SPPI
|
Diamond Pixel displays have only half the
number of
Red and Blue Sub-Pixels as RGB Stripe
displays.
At High PPI this is generally not visible
due to
the use of Sub-Pixel Rendering.
|
|
Total Number of Sub-Pixels
|
Red
2.2 Million Sub-Pixels
Green 4.4
Million Sub-Pixels
Blue
2.2 Million Sub-Pixels
|
Diamond Pixel displays have only half the
number of
Red and Blue Sub-Pixels as RGB Stripe
displays.
At High PPI this is generally not visible
due to
the use of Sub-Pixel Rendering.
|
|
20/20 Vision Distance
where Pixels or Sub-Pixels
are Not Resolved
|
7.1 inches / 18.0 cm for White and Green Sub-Pixels with 20/20 Vision
10.0
inches / 25.5 cm for Red and Blue Sub-Pixels with 20/20 Vision
|
For 20/20 Vision the minimum Viewing
Distance
where the screen appears perfectly sharp
to the eye.
At 10 inches from the screen 20/20 Vision
is 344 PPI.
|
|
Display Sharpness
at Typical Viewing Distances
|
vivo X Note
Display appears Perfectly Sharp
Pixels are
not Resolved with 20/20 Vision
at Typical
Viewing Distances of
10 to
18 inches
25 to 46
cm
|
The Typical Viewing Distances for this
screen size
are in the range of 10 to 18 inches or
25 to 46 cm.
Also note that eye’s resolution is much
lower for
Red and Blue color content than White
and Green.
|
|
Appears Perfectly Sharp
at Typical Viewing Distances
|
Yes
|
Typical Viewing Distances are 10 to 18
inches
or 25 to 46 cm for this screen size.
|
|
Overall Display Performance Assessments
This section summarizes
the results for all of the extensive Lab Measurements and Viewing Tests
performed on the display.
See Screen Reflections, Brightness
and Contrast, Colors and Intensities,
Absolute Color Accuracy, Viewing Angles, OLED Spectra
The
X Note has Automatic Color Management that switches to the appropriate Color
Gamut for Content with ICC Color Profiles.
Here
we provide results for the Standard mode, which has an Intentionally
Bluish White Point and Higher Image Contrast,
the
Professional DCI-P3 mode, which is calibrated for the new DCI-P3 Gamut that is used
in 4K Ultra HD TVs,
and
the Professional sRGB mode, which is calibrated for the sRGB / Rec.709 Gamut that is used for most current
consumer photo, video,
web, and computer content.
|
Categories
|
Standard
mode
Color
Management
|
Professional
mode
DCI-P3
Content
|
Professional
mode
sRGB
Content
|
Comments
|
|
Viewing Tests
in Subdued Ambient Lighting
|
Very Good
Images
Photos and
Videos
have a
Bluish White Point
and Higher
Contrast
Intentionally
Bluish Mode
|
Excellent
Images
Photos and
Videos
have
Excellent Color
and
Accurate Contrast
Accurate
DCI-P3 Content
|
Excellent
Images
Photos and
Videos
have
Excellent Color
and
Accurate Contrast
Accurate
sRGB Content
|
The Viewing Tests examine the accuracy
of
photographic images by comparing the
displays
to a calibrated studio monitor and TV.
|
|
Variation with Viewing Angle
Colors and Brightness
See Viewing Angles
|
Color
Shifts
Small to
Medium
with
Viewing Angle
Small
Brightness Shifts
with
Viewing Angle
|
Color
Shifts
Small to
Medium
with
Viewing Angle
Small
Brightness Shifts
with
Viewing Angle
|
Color
Shifts
Small to
Medium
with
Viewing Angle
Small
Brightness Shifts
with
Viewing Angle
|
The X Note display has a relatively
small
decrease in Brightness with Viewing
Angle and
Small to Medium Color Shifts with
Viewing Angle.
See the Viewing Angles section for details.
|
|
Overall Display Assessment
Lab Tests and Measurements
|
Excellent
OLED Display
Intentionally
Bluish Mode
|
Excellent
OLED Display
Accurate
DCI-P3 Content
|
Excellent
OLED Display
Accurate
sRGB Content
|
The X Note OLED Display performed
very well in the Lab Tests and
Measurements.
|
|
|
|
Absolute Color Accuracy
Measured over Entire Gamut
See Figure 2 and Colors
|
Good Color
Accuracy
Intentionally
Bluish Mode
|
Excellent
Color Accuracy
Color
Errors are Very Small
Accurate
DCI-P3 Content
|
Excellent
Color Accuracy
Color
Errors are Very Small
Accurate
sRGB Content
|
Absolute
Color Accuracy is measured with a
Spectroradiometer
for 41
Reference Colors
uniformly
distributed within the entire Color Gamut.
See
Figure 2 and Colors for details.
|
|
Image Contrast Accuracy
See Figure 3 and Contrast
|
Very Good
Accuracy
Image
Contrast
Intentionally
Higher
|
Excellent
Accuracy
Image
Contrast
Very
Accurate
|
Excellent
Accuracy
Image
Contrast
Very
Accurate
|
The
Image Contrast Accuracy is determined by
measuring
the Log Intensity Scale and Gamma.
See
Figure 3 and Contrast for details.
|
|
Performance in Ambient Light
Display Brightness
Screen Reflectance
Contrast Rating
See Brightness and Contrast
See Screen Reflections
|
High
Display Brightness
Very Low
Reflectance
High
Contrast Rating
for Ambient
Light
Higher
Brightness with
Auto
Brightness On
|
High
Display Brightness
Very Low
Reflectance
High
Contrast Rating
for Ambient
Light
Higher
Brightness with
Auto
Brightness On
|
High
Display Brightness
Very Low
Reflectance
High
Contrast Rating
for Ambient
Light
Higher
Brightness with
Auto
Brightness On
|
Smartphones
are seldom used in the dark.
Screen
Brightness and Reflectance determine
the
Contrast Rating for High Ambient Light.
See
the Brightness and Contrast section for details.
See
the Screen Reflections section for details.
|
|
Overall Display Calibration
Image and Picture Quality
Lab Tests and Viewing Tests
|
Intentionally
Bluish Mode
Higher
Image Contrast
|
Excellent
Calibration
Accurate
DCI-P3 Content
|
Excellent
Calibration
Accurate
sRGB Content
|
The X Note display has sRGB and DCI-P3
modes
that deliver accurately calibrated colors
and images
and a Standard mode that is preferred by
some users and for some applications.
|
|
|
Overall Display Grade
Overall
Assessment
|
Overall vivo X Note Display
Grade is Excellent A+
DisplayMate Best
Smartphone Display Award
with 16 Smartphone
Display Performance Records
including 8 that are
Visually Indistinguishable From Perfect
An Excellent Top Tier
World Class Smartphone Display
|
The vivo X Note display delivers
Excellent
Image Quality, has both Professional sRGB
and
Professional DCI-P3 modes and a Standard
mode
with Color Management, has High Screen
Brightness
and low Reflectance, has good Viewing
Angles, and
is an all around Top Performing
Smartphone Display.
|
|
Default
Color Mode
Also Best
for Viewing in
High
Ambient Light
|
Accurate
DCI-P3 Content
For Viewing
4K UHD TV
DCI-P3
Cinema Content
|
Accurate
sRGB mode
For Viewing
Most Content
Photo Video
Movie Web
|
Categories
|
Standard
mode
Color
Management
|
Professional
mode
DCI-P3
Content
|
Professional
mode
sRGB
Content
|
Comments
|
|
vivo X Note Conclusions: A Record
Setting Impressive Smartphone Display…
The primary goal of this Display Technology Shoot-Out
article series has always been to publicize and promote display
excellence so that consumers, journalists, reviewers, and even manufacturers
are aware of and appreciate the very best in displays and display technology.
We point out which manufacturers and display technologies are leading and
advancing the state-of-the-art for displays by performing comprehensive and
objective scientific Lab Tests and Measurements together with in-depth
analysis. We point out who is leading, who is behind, who is improving, and
sometimes (unfortunately) who is back pedaling.
All of the DisplayMate Display
Performance Grades, Ratings and Awards are based entirely on the extensive
objective Lab tests and measurements that we also publish, so that everyone
can judge and compare the display performance data for themselves as well.
With consumers now spending rapidly increasing amounts
of time watching content on their Smartphones, the shift in emphasis from
primarily improving Display Hardware Performance to enhancing the overall
Display Picture Quality and Color Accuracy is an important step that
DisplayMate Technologies has been pushing for many years in our Display
Technology Shoot-Out article series, so it is great to see
manufactures improving and then competing on these DisplayMate
Lab Measurement Objective Display Performance Metrics.
The vivo X
Note sets or matches 16 Smartphone Display Performance Records for:
Numerical Display Performance
Differences that are Visually Indistinguishable are considered Matched and
Tied Performance Records.
JNCD is a Just Noticeable
Color Difference
and APL is the Average
Picture Level
for on-screen Image Content.
· Highest Color Accuracy of White (0.3
JNCD for sRGB and 0.3 JNCD for DCI-P3) – Visually
Indistinguishable From Perfect.
· Highest Absolute Color Accuracy (0.5
JNCD for sRGB and 0.5 JNCD for DCI-P3) – Visually
Indistinguishable From Perfect.
· Smallest Maximum Color Error (1.1
JNCD for sRGB and 1.2 JNCD for DCI-P3) – Visually
Indistinguishable From Perfect.
·
Smallest Shift in Color Accuracy with APL (0.4 JNCD
for sRGB and 0.4 JNCD for DCI-P3) – Visually
Indistinguishable From Perfect.
·
Smallest Maximum
Color Shift with APL (0.6 JNCD for sRGB
and 0.6 JNCD for DCI-P3) – Visually
Indistinguishable From Perfect.
· Highest
Image Contrast Accuracy and
Intensity Scale Accuracy (2.20
Gamma) – Visually Indistinguishable From Perfect.
·
Smallest Shift in Image Contrast and
Intensity Scale with APL (0.01 Gamma)
– Visually Indistinguishable From Perfect.
·
Smallest Change in Peak Luminance with APL (1
percent) – Visually Indistinguishable From Perfect.
·
Highest Full
Screen Brightness for OLED Smartphones (996
nits at 100% APL).
· Highest Peak Display Brightness
(1,426 nits for Low APL).
· Largest Native Color Gamut (112%
DCI-P3 and 141% sRGB / Rec.709 for the Bright Color Mode).
· Highest Contrast Ratio (Infinite).
· Lowest Screen Reflectance (4.3
percent).
· Highest Contrast Rating in Ambient
Light (232 for 100% APL and 332 for Peak Brightness).
· Smallest Color Variation of White with Viewing Angle (2.0
JNCD at 30 degrees).
· Highest Visible Screen Resolution
3K (3080 x1440) – 4K Does Not Appear Visually
Sharper on a Smartphone.
The vivo X Note earns our Highest A+
Display Performance Assessment Rating
OLED has evolved into a highly refined and mature display
technology that produces the best and highest performance displays for
Smartphones.
OLED Display Performance
continues to provide major Record Setting improvements with every new generation.
vivo has concentrated on significantly raising the
on-screen Absolute Picture Quality and Absolute Color Accuracy of the OLED display by
implementing Precision Factory Display Calibration,
moving the overall X Note Display Performance
up to Record Setting Outstanding Levels with
close to Text Book Perfect Calibration Accuracy
that is Visually Indistinguishable From Perfect.
DisplayMate Display Performance Ratings:
All of the Results in this
article are based Entirely on our Objective and Extensive DisplayMate Lab
Tests and Measurements that are all listed in the sections below.
· To get a DisplayMate A Display
Performance Rating the display must get All Green [Very Good to Excellent]
Ratings for All of the Display Tests and Measurements [except for Color
Shifts at 30 degrees Viewing Angle, which are deemed less important].
· Then to get a DisplayMate A+ Display
Performance Rating the Average Absolute Color Accuracy and the Average Absolute
Color Accuracy Shifts with Average Picture Level APL must All be less
than 1.0 JNCD, and the Largest Color Errors must All be less than 3.0
JNCD.
The vivo X Note delivers Uniformly Consistent Top Tier Display Performance and receives All
Green [Very Good to Excellent] Ratings in All DisplayMate Lab Test Display Performance and Accuracy
Categories and has Absolute Color
Accuracy much better than 1.0 JNCD.
The vivo X Note display meets all of the criteria and
requirements for a DisplayMate A+ Grade, earning DisplayMate’s Highest
Overall Display Assessment Rating and Highest Display Performance Grade of
A+.
DisplayMate Display Performance Rating and
Best Smartphone Display Award
· Based on our extensive Lab Tests and Measurements the vivo X Note has
a Very Impressive Excellent Top Tier World Class Smartphone Display
with close to Text Book Perfect Calibration
Accuracy and Performance that is Visually
Indistinguishable From Perfect. Based
on our objective Lab Tests and Measurements the vivo
X Note receives a DisplayMate Best
Smartphone Display Award earning DisplayMate’s highest ever Display Performance Grade of A+ and setting or
matching 16 Smartphone Display Performance Records
including 8 that are Visually Indistinguishable
From Perfect that are listed above.
The vivo X Note joins the
very select Top Tier of Smartphone Displays which all provide Close to Text Book Perfect Calibration Accuracy and
Performance that is Visually Indistinguishable From Perfect, so they all
received and maintain Concurrent DisplayMate Best Smartphone Display
Awards. All are Excellent
State-of-the-Art Displays, each is better in some Display Performance
Categories, but None are Best in All the Display Performance Categories. Note
that measured numerical display performance differences that are Visually
Indistinguishable are equivalent.
As Display Performance continues to improve we have and
will continue to raise the Performance Levels necessary to receive a
DisplayMate Best Smartphone Display Award and an A+ Display Rating, so The Top Tier of Smartphone Displays will continue to
evolve and change with each new display generation, but only the Very Best
Displays will continue to receive A+ Ratings each year.
|
|
Screen Reflections
All display screens are mirrors good enough to use
for personal grooming – but that is actually a very bad feature…
We measured the light reflected from all directions
and also direct mirror (specular) reflections, which are much more
distracting and cause more eye strain. Many
Smartphones still have greater than 10 percent reflections that make
the screen much harder to read even in moderate
ambient light levels, requiring ever higher brightness settings that
waste precious battery power. Manufacturers should
reduce the mirror reflections with anti-reflection coatings and
matte or haze surface finishes.
Our Lab Measurements include Average
Reflectance for Ambient Light from All Directions and for Mirror Reflections.
We use an Integrating Hemisphere and a
highly collimated pencil light beam together with a Spectroradiometer.
Note that the Screen
Reflectance is exactly the same for all of the X Note Color Modes.
The X Note has close to the lowest
Screen Reflectance level that we have measured for a production Smartphone.
These results are extremely important
for Screen Readability, Picture Quality, and Color Accuracy in Ambient Light.
|
Categories
|
vivo X
Note
|
Comments
|
|
Average Screen Reflection
Light From All Directions
|
4.3 percent
for
Ambient Light Reflections
Excellent
|
Measured using an Integrating Hemisphere
and
a Spectroradiometer.
The lowest value we have measured
for a production Smartphone is 3.4
percent.
|
|
Mirror Reflections
Percentage of Light Reflected
|
5.4
percent
for Mirror Reflections
Very Good
|
These are the most annoying types of
Reflections.
Measured using a Spectroradiometer and a
narrow
collimated pencil beam of light
reflected off the screen.
The lowest value we have measured
for a production Smartphone is 4.3 percent.
|
|
Brightness and Contrast
The Contrast Ratio
is the specification that gets the most attention, but it only applies for
low ambient light, which is seldom
the case for mobile displays.
Much more important is the Contrast
Rating for High Ambient Light, which indicates how easy it is to read
the screen under
high ambient lighting and depends on both
the Maximum Brightness and the Screen Reflectance. The larger the better.
The display’s actual on-screen Contrast Ratio changes with the Ambient Light lux
level and is proportional to the Contrast Rating.
|
Categories
|
Standard
mode
Color
Management
|
Professional
mode
DCI-P3
Content
|
Professional
mode
sRGB
Content
|
Comments
|
|
Home Screen Peak Brightness
Measured for White
|
Brightness
424 cd/m2
Very Good
|
Brightness
388 cd/m2
Very Good
|
Brightness
388 cd/m2
Very Good
|
The Peak Brightness for White on the
Home Screen.
|
|
Measured Average Brightness
50% Average Picture Level
|
Brightness
549 cd/m2
Excellent
|
Brightness
481 cd/m2
Very Good
|
Brightness
480 cd/m2
Very Good
|
This is the Brightness for typical
screen content
that has a 50% Average Picture Level.
|
|
Measured Full Brightness
100% Full Screen White
|
Brightness
497 cd/m2
Very Good
|
Brightness
476 cd/m2
Very Good
|
Brightness
477 cd/m2
Very Good
|
This is the Brightness for a screen that
is entirely
all white with 100% Average Picture
Level.
|
|
Measured Peak Brightness
1% Average Picture Level
|
Brightness
613 cd/m2
Excellent
|
Brightness
480 cd/m2
Very Good
|
Brightness
477 cd/m2
Very Good
|
This is the Peak Brightness for a screen
that
has only a tiny 1% Average Picture
Level.
|
|
Dynamic Brightness
Change in Luminance with
Average Picture Level APL
|
19 percent
Decrease
Intentionally
Large
|
1 percent
Decrease
Excellent
|
1 percent
Decrease
Excellent
|
This is the percent Brightness decrease
with APL
Average Picture Level. Ideally should be
0 percent.
Higher values may improve Contrast in
Ambient Light.
|
|
Low Ambient Light
|
|
Lowest Peak Brightness
Super Dimming Mode
Brightness Slider to Minimum
|
2 cd/m2
For Very
Low Light
|
2 cd/m2
For Very
Low Light
|
2 cd/m2
For Very
Low Light
|
This is the Lowest Brightness with the
Slider set to
Minimum. This is useful for working in
very dark
environments. Picture Quality remains
Excellent.
|
|
Black Brightness at 0 lux
at Maximum Brightness Setting
|
0 cd/m2
Outstanding
|
0 cd/m2
Outstanding
|
0 cd/m2
Outstanding
|
Black Brightness is important for Low
Ambient Light,
which is seldom the case for mobile
devices.
|
|
Contrast Ratio at 0 lux
Relevant for Low Ambient Light
|
Infinite
Outstanding
|
Infinite
Outstanding
|
Infinite
Outstanding
|
Only relevant for Low Ambient Light,
which is seldom the case for mobile
devices.
|
|
Always On Display Mode
White Luminance
|
Dim
1 cd/m2
Bright
29 cd/m2
|
Dim
1 cd/m2
Bright
28 cd/m2
|
Dim
1 cd/m2
Bright
28 cd/m2
|
Displayed image content when the
Smartphone
is in Standby Mode.
|
|
High Brightness Mode
Automatic Brightness in High Ambient
Light
|
|
Measured High Brightness Mode
50% Average Picture Level
|
High
Brightness Mode
1,167 cd/m2
Excellent
|
High
Brightness Mode
968 cd/m2
Excellent
|
High
Brightness Mode
969 cd/m2
Excellent
|
This is the Brightness for typical
screen content
that has a 50% Average Picture Level.
|
|
Measured High Brightness Mode
100% Full screen White
|
High
Brightness Mode
996 cd/m2
Excellent
|
High
Brightness Mode
962 cd/m2
Excellent
|
High
Brightness Mode
963 cd/m2
Excellent
|
This is the Brightness for a screen that
is entirely
all white with 100% Average Picture
Level.
|
|
Measured High Brightness Mode
1% Average Picture Level
|
High
Brightness Mode
1,426 cd/m2
Excellent
|
High Brightness
Mode
946 cd/m2
Excellent
|
High
Brightness Mode
947 cd/m2
Excellent
|
This is the Peak Brightness for a screen
that
has only a small 1% Average Picture
Level.
|
|
Dynamic Brightness
Change in Luminance with
Average Picture Level APL
|
30 percent
Decrease
Intentionally
Large
|
2 percent
Decrease
Excellent
|
2 percent
Decrease
Excellent
|
This is the percent Brightness decrease
with APL
Average Picture Level. Ideally should be
0 percent.
Higher values may improve Contrast in
Ambient Light.
|
|
High Ambient Light Contrast Rating
|
|
Contrast Rating
for High Ambient Light
The Higher the Better
for Screen Readability
in High Ambient Light
|
116 – 143
With Manual
Brightness
Very Good
232 – 332
High
Brightness Mode
Excellent
|
111 – 112
With Manual
Brightness
Very Good
220 – 225
High
Brightness Mode
Excellent
|
111 – 112
With Manual
Brightness
Very Good
220 – 225
High
Brightness Mode
Excellent
|
Depends on the Screen Reflectance and
Brightness.
Defined as Maximum Brightness / Average Reflectance.
The display’s actual on-screen Contrast
Ratio
changes with the Ambient Light lux level
and
is proportional to the Contrast Rating.
|
|
Screen Readability
in High Ambient Light
|
Very Good A
With Manual
Brightness
Excellent A+
With Auto
Brightness On
|
Very Good A
With Manual
Brightness
Excellent A+
With Auto
Brightness On
|
Very Good A
With Manual
Brightness
Excellent A+
With Auto
Brightness On
|
Indicates how easy it is to read the
screen
under High Ambient Lighting. Depends on
both the Screen Reflectance and
Brightness.
See High
Ambient Light Screen Shots
|
|
Colors and Intensities
The Color Gamut, Intensity
Scale, and White Point determine the
quality and accuracy of all displayed images and all
the image
colors. Bigger is definitely Not Better because the display needs to match
all the Standards that were used
when the content was produced.
The X Note has Automatic Color
Management that switches to the appropriate Color Gamut for Content with ICC
Color Profiles.
The X Note also has a Bright Color mode with
the Native Color Gamut of the OLED Display,
which is 112% of the DCI-P3 Gamut and 141% of the sRGB Gamut. The
White Point is 7,140 K.
|
Categories
|
Standard
mode
Color
Management
|
Professional
mode
DCI-P3
Content
|
Professional
mode
sRGB
Content
|
Comments
|
|
Color of White
Color Temperature in degrees
Measured in the dark at 0 lux
The White
Point is Adjustable
with the Eye Protection Mode
Interactive Slider Button
|
7,100 K
2.4 JNCD
from D65 White
Bluish
White Point
Intentionally
Bluish Mode
See Figure
1
|
6,440 K
0.3 JNCD
from D65 White
Very Close
to Standard
Excellent
Accurate
White Point
See Figure
1
|
6,440 K
0.3 JNCD
from D65 White
Very Close
to Standard
Excellent
Accurate
White Point
See Figure
1
|
D65 with 6,500 K is the standard color
of White
for most Consumer Content and needed for
accurate color reproduction of all images.
JNCD is a Just Noticeable Color Difference.
White Point accuracy is more critical than
other colors.
See Figure
1 for the plotted White Points.
See Figure 2 for the
definition of JNCD
|
|
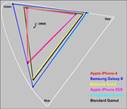
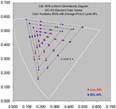
Color Gamut
Measured in the dark at 0 lux
See Figure
1
|
112 percent
DCI-P3
Cinema Gamut
Very Close
to Standard
118 percent
sRGB /
Rec.709 Gamut
Very Close
to Standard
See Figure
1
|
101 percent
DCI-P3
Cinema Gamut
Very Close
to Standard
Excellent
Accurate
DCI-P3 Content
See Figure
1
|
101 percent
sRGB /
Rec.709 Gamut
Very Close
to Standard
Excellent
Accurate
sRGB Content
See Figure 1
|
Most current consumer content uses sRGB /
Rec.709.
The new 4K UHD TVs and Digital Cinema use
DCI-P3.
A Wide Color Gamut is useful in High
Ambient Light
and for some applications. It can be used
with Color
Management to dynamically change the
Gamut.
See Figure 1
|
|
Color Gamut in Ambient Light
Measured at 1,000 lux
Display Brightness set at Maximum
1,000 lux corresponds to
very bright indoor lighting or
outdoor daylight with an
overcast sky.
|
at 1,000
lux
86 percent
DCI-P3
Cinema Gamut
87 percent
sRGB /
Rec.709 Gamut
Very Good
See
Figure 1
|
at 1,000
lux
81 percent
DCI-P3
Cinema Gamut
Very Good
See
Figure 1
|
at 1,000
lux
82 percent
sRGB /
Rec.709 Gamut
Very Good
See
Figure 1
|
The visible on-screen Color Gamut
decreases
as the Ambient Light level increases.
The Ambient Light level is measured in
lux.
The Gamut Depends on both the Display
Brightness
and the Screen Reflectance.
See
Figure 1
|
|
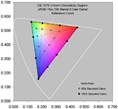
Absolute Color Accuracy
|
|
Absolute Color Accuracy
Average Color Error at 0 lux
For 41 Reference Colors
Just Noticeable Color Difference
See Figure 2
|
Average
Color Error
From sRGB
/ Rec.709
Δ(u’v’)
= 0.0095
2.4 JNCD
Average
Color Error
From
DCI-P3
Δ(u’v’)
= 0.0092
2.3 JNCD
Intentionally
Bluish Mode
|
Average
Color Error
From
DCI-P3
Δ(u’v’)
= 0.0021
0.5 JNCD
Excellent
Accuracy
Accurate
DCI-P3 Content
See Figure 2
|
Average Color Error
From sRGB
/ Rec.709
Δ(u’v’)
= 0.0019
0.5 JNCD
Excellent
Accuracy
Accurate
sRGB Content
See Figure 2
|
JNCD is a Just Noticeable Color Difference.
See Figure 2 for the
definition of JNCD and for the
Accuracy Plots showing
the measured Color Errors.
Color Errors below 2.0 JNCD are
Excellent.
Color Errors below 3.5 JNCD are Very
Good.
Color Errors 3.5 to 7.0 JNCD are
Good.
Color Errors above 7.0 JNCD are
Poor.
|
|
Absolute Color Accuracy
Maximum Color Error at 0 lux
For 41 Reference Colors
Just Noticeable Color Difference
See Figure 2
|
Largest Color Error
From sRGB
/ Rec.709
Δ(u’v’)
= 0.0201
5.0 JNCD
for 50%
Blue
Largest Color Error
From
DCI-P3
Δ(u’v’)
= 0.0226
5.7 JNCD
for 50%
Blue
Intentionally
Bluish Mode
|
Largest Color Error
From DCI-P3
Δ(u’v’)
= 0.0048
1.2 JNCD
for 100%
Magenta
Excellent
Accuracy
Accurate
DCI-P3 Content
See Figure 2
|
Largest Color Error
From sRGB
/ Rec.709
Δ(u’v’)
= 0.0042
1.1 JNCD
for 50%
Cyan-Blue
Excellent
Accuracy
Accurate
sRGB Content
See Figure 2
|
JNCD is a Just Noticeable Color Difference.
See Figure 2 for the
definition of JNCD and for the
Accuracy Plots showing
the measured Color Errors.
Color Errors below 2.0 JNCD are
Excellent.
Color Errors below 3.5 JNCD are Very
Good.
Color Errors 3.5 to 7.0 JNCD are
Good.
Color Errors above 7.0 JNCD are
Poor.
|
|
Changes in Absolute Color Accuracy with Average Picture Level APL
Measured Shifts in the Absolute Color Accuracy with Image Content
from Low 1% APL to High 50% APL
|
|
Shift in the Color of White
Just Noticeable Color Difference
See Figure 4
|
White Point
Color Shift
from Low
to High APL
Δ(u’v’)
= 0.0026
0.7 JNCD
Excellent
|
White Point
Color Shift
from Low
to High APL
Δ(u’v’)
= 0.0017
0.4 JNCD
Excellent
See Figure 4
|
White Point
Color Shift
from Low
to High APL
Δ(u’v’)
= 0.0017
0.4 JNCD
Excellent
See Figure 4
|
JNCD is a Just Noticeable Color Difference
See Figure 2 for the
definition of JNCD.
See Figure 4 for the
measured Color Shifts.
Color Shifts below 2.0 JNCD are
Excellent.
Color Shifts below 3.5 JNCD are Very
Good.
Color Shifts 3.5 to 7.0 JNCD are
Good.
Color Shifts above 7.0 JNCD are
Poor.
|
|
Average Color Shift
For 41 Reference Colors
Just Noticeable Color Difference
See Figure 4
|
Standard
mode
Intentionally
Variable
|
Average
Color Shift
from Low
to High APL
Δ(u’v’)
= 0.0016
0.4 JNCD
Excellent
See Figure 4
|
Average
Color Shift
from Low
to High APL
Δ(u’v’)
= 0.0015
0.4 JNCD
Excellent
See Figure 4
|
JNCD is a Just Noticeable Color Difference.
See Figure 2 for the
definition of JNCD.
See Figure 4 for the
measured Color Shifts.
Color Shifts below 2.0 JNCD are
Excellent.
Color Shifts below 3.5 JNCD are Very
Good.
Color Shifts 3.5 to 7.0 JNCD are
Good.
Color Shifts above 7.0 JNCD are
Poor.
|
|
Maximum Color Shift
For 41 Reference Colors
Just Noticeable Color Difference
See Figure 4
|
Standard
mode
Intentionally
Variable
|
Largest Color Shift
from Low
to High APL
Δ(u’v’)
= 0.0025
0.6 JNCD
for 100%
Cyan-Blue
Excellent
See Figure 4
|
Largest Color Shift
from Low
to High APL
Δ(u’v’)
= 0.0024
0.6 JNCD
for 50%
Blue
Excellent
See Figure 4
|
JNCD is a Just Noticeable Color Difference
See Figure 2 for the
definition of JNCD.
See Figure 4 for the
measured Color Shifts.
Color Shifts below 2.0 JNCD are
Excellent.
Color Shifts below 3.5 JNCD are Very
Good.
Color Shifts 3.5 to 7.0 JNCD are
Good.
Color Shifts above 7.0 JNCD are
Poor.
|
|
|
|
Dynamic Brightness
Change in Luminance with
Average Picture Level APL
|
19 percent
Decrease
Intentionally
Large
|
1 percent
Decrease
Excellent
|
1 percent
Decrease
Excellent
|
This is the percent Brightness decrease
with APL
Average Picture Level. Ideally should be
0 percent.
|
|
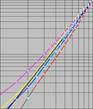
Intensity Scale and
Image Contrast
See Figure
3
|
Smooth and
Straight
Very Good
Slightly
Too Steep
Intentionally
Steeper
|
Very
Smooth and Straight
Excellent
Very
Accurate
See Figure 3
|
Very
Smooth and Straight
Excellent
Very
Accurate
See Figure 3
|
The Intensity Scale controls image
contrast needed
for accurate Image Contrast and Color
reproduction.
See Figure
3
|
|
Gamma for the Intensity Scale
Larger has more Image Contrast
See Figure
3
|
Gamma 2.33
to 2.41
Very Good
Gamma
Intentionally High
|
Gamma 2.20
Excellent
Gamma Very
Accurate
|
Gamma 2.20
Excellent
Gamma Very
Accurate
|
Gamma is the log slope of the Intensity
Scale.
Gamma of 2.20 is the standard and needed
for
accurate Image Contrast and Color
reproduction.
See Figure
3
|
|
Image Contrast Accuracy
|
Very Good
|
Excellent
|
Excellent
|
See Figure
3
|
|
Viewing Angles
The variation of
Brightness, Contrast, and Color with Viewing Angle is especially important
for Smartphones because
of their larger screen
and multiple viewers. The typical manufacturer 176+ degree specification for
LCD Viewing Angle
is nonsense because that
is where the Contrast Ratio falls to a miniscule 10. For most LCDs there are
substantial
degradations at less
than ±30 degrees, which is not an atypical Viewing Angle for Smartphones and
Tablets.
The
Viewing Angle variations are essentially identical for all of the X Note
Color Modes.
Note
that the Viewing Angle performance is also very important for a single viewer
because the Viewing Angle can vary
significantly
based on how the Smartphone is held. The Viewing Angle can be very large if
resting on a table or desk.
· The X Note display has a Brightness (Luminance) fall off
with Viewing Angle that is much smaller than the best LCD displays.
Color Shifts:
· The White Point Color Shift is the most viewer noticeable
Color Shift with Viewing Angle because it is often the screen background.
The X Note has a relatively small White Shift of just 2.0 JNCD at 30 degrees, which is unlikely to be
noticeable.
·
The Color Shifts throughout the entire Color
Gamut vary as combinations of the Primary Color Shifts.
·
The Color Shift for the Red Primary at 30 degrees
Viewing Angle is 3.1 JNCD, which is unlikely to be noticeable.
· The Color Shift for the Green
Primary at 30 degrees Viewing Angle
is 2.5 JNCD, which
is unlikely to be noticeable.
·
The Color Shift for the Blue Primary at 30
degrees Viewing Angle is 3.7 JNCD, slightly greater than the 3.5 JNCD limit for a
Green
Very Good Rating. But Color Shifts in the Blue Region are less visually
noticeable as discussed in this article
Most
current model OLED Smartphone Displays have 1 or 2 Primary Color Shift Yellow
ratings.
|
Categories
|
Standard
mode
Color
Management
|
Professional
mode
DCI-P3
Content
|
Professional
mode
sRGB
Content
|
Comments
|
|
Brightness Decrease
at a 30 degree Viewing Angle
|
35 percent
Decrease
Small
Decrease
Very Good
|
Most screens become less bright when
tilted.
LCD decrease is generally greater than 50
percent.
|
|
Contrast Ratio at 0 lux
at a 30 degree Viewing Angle
|
Infinite
Contrast Ratio
Outstanding
|
A measure of screen readability when the
screen
is tilted under low ambient lighting.
|
|
White Point Color Shift
at a 30 degree Viewing Angle
|
Small Color
Shift
Δ(u’v’)
= 0.0079
2.0 JNCD
Very Good
|
JNCD is a Just Noticeable Color Difference.
See Figure 2 for the
definition of JNCD.
Color Shifts below 3.5 JNCD are Very
Good
|
|
Color Shifts for the Primaries
|
|
Red Primary Color Shift
at a 30 degree Viewing Angle
|
Small Color
Shift
Δ(u’v’)
= 0.0123
3.1 JNCD
Very Good
|
JNCD is a Just Noticeable Color Difference.
See Figure 2 for the
definition of JNCD.
Color Shifts below 3.5 JNCD are Very
Good
|
|
Green Primary Color Shift
at a 30 degree Viewing Angle
|
Small Color
Shift
Δ(u’v’)
= 0.0100
2.5 JNCD
Very Good
|
JNCD is a Just Noticeable Color Difference.
See Figure 2 for the
definition of JNCD.
Color Shifts below 3.5 JNCD are Very
Good
|
|
Blue Primary Color Shift
at a 30 degree Viewing Angle
|
Medium
Color Shift
Δ(u’v’)
= 0.0147
3.7 JNCD
Good
|
JNCD is a Just Noticeable Color Difference.
See Figure 2 for the
definition of JNCD.
Color Shifts 3.5 to 7.0 JNCD are
Good
|
|
|
|
Color Shifts for Color Mixtures
at a 30 degree Viewing Angle
Reference Brown (255, 128, 0)
|
Small
Color Shift
Δ(u’v’)
= 0.0018
0.4 JNCD Excellent
|
JNCD is a Just Noticeable Color Difference.
Color Shifts for non-IPS LCDs are about 10
JNCD.
Reference Brown is a good indicator of
color shifts
with angle because of unequal drive
levels and
roughly equal luminance contributions
from Red
and Green. See Figure 2 for the
definition of JNCD.
|
|
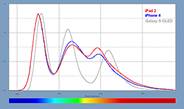
Display Spectra
The Display Spectra for the Standard and sRGB and DCI-P3
Professional Color Modes and for the Eye Protection Mode are measured in Figure 5 below.
The Display White Point is Adjustable:
with the Eye Protection Mode and Interactive Slider
Button.
· The Eye Protection Mode is designed to change
the color balance of the display in order to reduce the amount of Blue Light
produced by the display,
which some recent research indicates can affect how well users sleep
afterwards.
The
White Point can shift down to a Warm 3,490 K See Figure 5.
· The Interactive Slider
Button in Display Settings allows the White Point Color Temperature to
be adjusted interactively.
The White Point can shift between 5,900 to 7,370 K for
the Professional Mode, and 4,880 to 9,330 K for the Standard Mode.
|