|
Categories
|
OPPO
Find X2
|
Comments
|
|
Display Technology
|
Flexible
OLED Display
with Diamond
Pixels
6.8 inch
Diagonal / 17.5 cm Diagonal
Excluding the Rounded
Corners
|
Flexible Organic Light Emitting Diode
Diamond
Pixels
with Diagonal Sub-Pixel Symmetry.
|
|
Screen Aspect Ratio
|
19.8: 9 =
2.20
New Higher
Aspect Ratio
Most
Smartphones and Widescreen TVs have 16 : 9 = 1.78
|
Height to Width Aspect Ratio
OPPO Find X2 display screen is 24%
longer than
most Smartphones and widescreen 16:9 TV
content.
|
|
Screen Size
|
2.81
x 6.18 inches
7.13 x
15.68 cm
|
Display Width and Height in inches and
cm.
|
|
Screen Area
|
17.3
square inches / 111.8 square cm
After
Subtracting the Camera Opening but not the Rounded Corners
|
A better measure of size than the
diagonal length.
|
|
Supported Color Gamuts
|
Vivid mode
– Wide Color Gamut with Higher Contrast
Cinematic
DCI-P3 mode – DCI-P3 Standard Color Gamut
Gentle sRGB
mode – sRGB / Rec.709 Standard Color Gamut
|
The OPPO Find X2 supports 2 Standard
Color Gamuts: sRGB and the new wider
DCI-P3
Color Gamut that is used in 4K Ultra HD
TV content.
|
|
Display Refresh Rates
|
Display
Frames Per Second
Normal 60
Hz
High 120 Hz
for Smoother Scrolling and Motion
|
Higher Refresh Rates improve image
Scrolling
plus Video and Motion Performance in
Apps,
and may reduce Screen Flicker that some
people experience.
|
|
Display Resolution
|
3168 x 1440
pixels
New 3K
Quad HD+
|
Screen Pixel Resolution.
Quad HD can display four 1280x720 HD
images.
|
|
Total Number of Pixels
|
4.6 Mega
Pixels
|
Total Number of Display Pixels.
|
|
Pixels Per Inch PPI
|
513 PPI
with Diamond Pixels
Excellent
|
Sharpness depends on the viewing distance
and PPI.
See this on
the visual acuity for a true Retina Display
|
|
Sub-Pixels Per Inch
|
Red
363 SPPI
Green
513 SPPI
Blue
363 SPPI
|
Diamond Pixel displays have only half the
number of
Red and Blue Sub-Pixels as RGB Stripe
displays.
|
|
Total Number of Sub-Pixels
|
Red
2.3 Million Sub-Pixels
Green 4.6
Million Sub-Pixels
Blue
2.3 Million Sub-Pixels
|
Number of Mega Sub-Pixels for Red,
Green, Blue.
Diamond Pixel displays have only half the
number of
Red and Blue Sub-Pixels as RGB Stripe
displays.
At High PPI this is generally not visible
due to the
use of Sub-Pixel Rendering.
|
|
20/20 Vision Distance
where Pixels or Sub-Pixels
are Not Resolved
|
6.7
inches / 17.0 cm for White and Green Sub-Pixels with 20/20 Vision
9.5
inches / 24.1 cm for Red and Blue Sub-Pixels with 20/20 Vision
|
For 20/20 Vision the minimum Viewing
Distance
where the screen appears perfectly sharp
to the eye.
At 10 inches from the screen 20/20 Vision
is 344 PPI.
|
|
Display Sharpness
at Typical Viewing Distances
|
OPPO Find X2 Display
appears Perfectly Sharp
Pixels are
not Resolved with 20/20 Vision
at Typical
Viewing Distances of
10 to
18 inches
25 to 46
cm
|
The Typical Viewing Distances for this
screen size
are in the range of 10 to 18 inches or
25 to 46 cm.
Also note that eye’s resolution is much
lower for
Red and Blue color content than White
and Green.
|
|
Appears Perfectly Sharp
at Typical Viewing Distances
|
Yes
|
Typical Viewing Distances are 10 to 18
inches
or 25 to 46 cm for this screen size.
|
|
Overall Assessments
This section summarizes
the results for all of the extensive Lab Measurements and Viewing Tests performed
on the display.
See Screen Reflections, Brightness
and Contrast, Colors and Intensities,
Viewing Angles, OLED
Spectra
Here
we provide results for the Vivid mode, which has a Wide Color Gamut and Higher Image Contrast,
the
Cinematic DCI-P3 mode, which is calibrated for the new DCI-P3 Gamut that is used
in 4K Ultra HD TVs,
and
the Gentle sRGB mode, which is calibrated for the sRGB / Rec.709 Gamut that is used for most current
consumer photo, video,
web, and computer content.
|
Categories
|
Vivid
mode
Wide Color
Gamut
|
Cinematic
mode
DCI-P3
Content
|
Gentle
mode
sRGB
Content
|
Comments
|
|
Viewing Tests
in Subdued Ambient Lighting
|
Very Good
Images
Photos and
Videos
have Vivid
Color
and Higher
Contrast
Intentionally
Vivid Colors
|
Excellent
Images
Photos and
Videos
have
Excellent Color
and
Accurate Contrast
Accurate
DCI-P3 Content
|
Excellent
Images
Photos and
Videos
have
Excellent Color
and
Accurate Contrast
Accurate
sRGB Content
|
The Viewing Tests examine the accuracy
of
photographic images by comparing the
displays
to a calibrated studio monitor and TV.
|
|
Variation with Viewing Angle
Colors and Brightness
See Viewing Angles
|
Color
Shifts
Small to
Medium
with
Viewing Angle
Small
Brightness Shifts
with
Viewing Angle
|
Color
Shifts
Small to
Medium
with
Viewing Angle
Small
Brightness Shifts
with
Viewing Angle
|
Color
Shifts
Small to
Medium
with
Viewing Angle
Small
Brightness Shifts
with
Viewing Angle
|
The OPPO Find X2 display has a
relatively small
decrease in Brightness with Viewing
Angle and
relatively small Color Shifts with
Viewing Angle.
See the Viewing Angles section for details.
|
|
Overall Display Assessment
Lab Tests and Measurements
|
Excellent
OLED Display
Vivid Color
Mode
|
Excellent
OLED Display
Accurate
DCI-P3 Content
|
Excellent
OLED Display
Accurate
sRGB Content
|
The OPPO Find X2 OLED Display performed
very well in the Lab Tests and
Measurements.
|
|
|
|
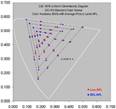
Absolute Color Accuracy
Measured over Entire Gamut
See Figure 2 and Colors
|
Good Color
Accuracy
Colors
More Saturated
Intentionally
Vivid Colors
|
Excellent
Color Accuracy
Color
Errors are Very Small
Accurate
DCI-P3 Content
|
Excellent
Color Accuracy
Color
Errors are Very Small
Accurate
sRGB Content
|
Absolute
Color Accuracy is measured with a
Spectroradiometer
for 41
Reference Colors
uniformly
distributed within the entire Color Gamut.
See
Figure 2 and Colors for details.
|
|
Image Contrast Accuracy
See Figure 3 and Contrast
|
Very Good
Accuracy
Image
Contrast
Intentionally
Higher
|
Excellent
Accuracy
Image
Contrast
Very
Accurate
|
Excellent
Accuracy
Image
Contrast
Very
Accurate
|
The
Image Contrast Accuracy is determined by
measuring
the Log Intensity Scale and Gamma.
See
Figure 3 and Contrast for details.
|
|
Performance in Ambient Light
Display Brightness
Screen Reflectance
Contrast Rating
See Brightness and Contrast
See Screen Reflections
|
High
Display Brightness
Record Low
Reflectance
High
Contrast Rating
for
Ambient Light
Higher
Brightness with
Auto
Brightness On
|
High
Display Brightness
Record Low
Reflectance
High
Contrast Rating
for
Ambient Light
Higher
Brightness with
Auto
Brightness On
|
High
Display Brightness
Record Low
Reflectance
High
Contrast Rating
for
Ambient Light
Higher
Brightness with
Auto
Brightness On
|
Smartphones
are seldom used in the dark.
Screen
Brightness and Reflectance determine
the
Contrast Rating for High Ambient Light.
See
the Brightness and Contrast section for details.
See
the Screen Reflections section for details.
|
|
Overall Display Calibration
Image and Picture Quality
Lab Tests and Viewing Tests
|
Wide Color
Gamut Mode
Intentionally
Vivid Colors
and Higher Image
Contrast
|
Excellent Calibration
Accurate
DCI-P3 Content
|
Excellent Calibration
Accurate
sRGB Content
|
OPPO Find X2 display has Gentle and
Cinematic Modes
that deliver accurately calibrated
colors and images
and a Vivid Color Mode that is preferred
by
some users and for some applications.
|
|
|
Overall Display Grade
Overall
Assessment
|
Overall OPPO Find X2 Display
Grade is Excellent A+
DisplayMate Best
Smartphone Display Award
with 12 Smartphone
Display Performance Records
An Excellent Top Tier
World Class Smartphone Display
|
The OPPO Find X2 display delivers
Excellent
Image Quality, has both Gentle sRGB and
Cinematic DCI-P3 modes and a Vivid Mode
with
a Wide Color Gamut, has High Screen
Brightness
and low Reflectance, has good Viewing
Angles, and
is an all around Top Performing
Smartphone Display.
|
|
Vivid Color
Mode
Also Best
for Viewing in
High
Ambient Light
|
Accurate
DCI-P3 Content
For Viewing
4K UHD TV
DCI-P3
Cinema Content
|
Accurate
sRGB mode
For Viewing
Most Content
Photo Video
Movie Web
|
Categories
|
Vivid
mode
Wide Color
Gamut
|
Cinematic
mode
DCI-P3
Content
|
Gentle
mode
sRGB
Content
|
Comments
|
|
The OPPO
Find X2 sets or matches 12 Smartphone Display Performance Records for:
Numerical Performance
Differences that are Visually Indistinguishable are considered Matched and
Tied Performance Records.
· Highest Absolute Color Accuracy (0.4 JNCD) – Visually Indistinguishable From Perfect.
· Highest Image Contrast Accuracy and
Intensity Scale Accuracy (2.21 Gamma) – Visually Indistinguishable From Perfect.
·
Smallest Shift
in Color Accuracy and Intensity Scale with the Image Content APL (0.2
JNCD) – Visually Indistinguishable From Perfect.
·
Smallest Shift in Image Contrast and
Intensity Scale with the Image Content APL (0.01 Gamma) – Visually Indistinguishable From Perfect.
·
Highest Full
Screen Brightness for OLED Smartphones (800 nits at 100% APL).
· Highest Peak Display Brightness (1,360 nits for Low APL).
· Highest Contrast Ratio (Infinite).
· Lowest Screen Reflectance (4.4 percent).
· Highest Contrast Rating in Ambient Light (182 for
100% APL and 309 for Peak Brightness).
· Smallest Brightness Variation with Viewing Angle (23
percent at 30 degrees).
· Smallest Color Variation of White with Viewing Angle (1.0
JNCD at 30 degrees).
· Highest Visible Screen Resolution
3K (3168x1440) – 4K Does Not Appear Visually
Sharper on a Smartphone.
|
|
Screen Reflections
All display screens are mirrors good enough to use
for personal grooming – but that is actually a very bad feature…
We measured the light reflected from all directions
and also direct mirror (specular) reflections, which are much more
distracting and cause more eye strain. Many
Smartphones still have greater than 10 percent reflections that make
the screen much harder to read even in moderate
ambient light levels, requiring ever higher brightness settings that
waste precious battery power. Manufacturers should
reduce the mirror reflections with anti-reflection coatings and
matte or haze surface finishes.
Our Lab Measurements include Average
Reflectance for Ambient Light from All Directions and for Mirror Reflections.
We use an Integrating Hemisphere and a
highly collimated pencil light beam together with a Spectroradiometer.
Note that the Screen
Reflectance is exactly the same for all of the OPPO Find X2 Screen Modes.
The OPPO Find X2 has close to the lowest
Screen Reflectance level that we have ever measured for a Smartphone.
These results are extremely important
for screen readability, picture quality, and color accuracy in ambient light.
|
Categories
|
OPPO
Find X2
|
Comments
|
|
Average Screen Reflection
Light From All Directions
|
4.4 percent
for
Ambient Light Reflections
Excellent
|
Measured using an Integrating Hemisphere
and
a Spectroradiometer.
The lowest value we have ever measured
for a Smartphone is 4.3 percent.
|
|
Mirror Reflections
Percentage of Light Reflected
|
5.3 percent
for Mirror Reflections
Very Good
|
These are the most annoying types of
Reflections.
Measured using a Spectroradiometer and a
narrow
collimated pencil beam of light
reflected off the screen.
The lowest value we have ever measured
for a Smartphone is 5.3 percent.
|
|
Brightness and Contrast
The Contrast Ratio
is the specification that gets the most attention, but it only applies for
low ambient light, which is seldom
the case for mobile displays.
Much more important is the Contrast
Rating for High Ambient Light, which indicates how easy it is to read
the screen under
high ambient lighting and depends on both
the Maximum Brightness and the Screen Reflectance. The larger the better.
The display’s actual on-screen Contrast Ratio changes with the Ambient Light lux
level and is proportional to the Contrast Rating.
|
Categories
|
Vivid
mode
Wide Color
Gamut
|
Cinematic
mode
DCI-P3
Content
|
Gentle
mode
sRGB
Content
|
Comments
|
|
Home Screen Peak Brightness
Measured for White
|
Brightness
696 cd/m2
Excellent
|
Brightness
484 cd/m2
Very Good
|
Brightness
484 cd/m2
Very Good
|
The Peak Brightness for White on the
Home Screen.
|
|
Measured Average Brightness
50% Average Picture Level
|
Brightness
580 cd/m2
Excellent
|
Brightness
473 cd/m2
Very Good
|
Brightness
473 cd/m2
Very Good
|
This is the Brightness for typical
screen content
that has a 50% Average Picture Level.
|
|
Measured Full Brightness
100% Full Screen White
|
Brightness
502 cd/m2
Very Good
|
Brightness
486 cd/m2
Very Good
|
Brightness
489 cd/m2
Very Good
|
This is the Brightness for a screen that
is entirely
all white with 100% Average Picture
Level.
|
|
Measured Peak Brightness
1% Average Picture Level
|
Brightness
735 cd/m2
Excellent
|
Brightness
459 cd/m2
Very Good
|
Brightness
458 cd/m2
Very Good
|
This is the Peak Brightness for a screen
that
has only a tiny 1% Average Picture
Level.
|
|
Dynamic Brightness
Change in Luminance with
Average Picture Level APL
|
32 percent
Decrease
Intentionally
Large
|
6 percent
Decrease
Very Good
|
6 percent
Decrease
Very Good
|
This is the percent Brightness decrease
with APL
Average Picture Level. Ideally should be
0 percent.
|
|
Low Ambient Light
|
|
Lowest Peak Brightness
Super Dimming Mode
Brightness Slider to Minimum
|
2 cd/m2
For Very
Low Light
|
2 cd/m2
For Very
Low Light
|
2 cd/m2
For Very
Low Light
|
This is the Lowest Brightness with the
Slider set to
Minimum. This is useful for working in
very dark
environments. Picture Quality remains
Excellent.
|
|
Black Brightness at 0 lux
at Maximum Brightness Setting
|
0 cd/m2
Outstanding
|
0 cd/m2
Outstanding
|
0 cd/m2
Outstanding
|
Black Brightness is important for Low
Ambient Light,
which is seldom the case for mobile
devices.
|
|
Contrast Ratio at 0 lux
Relevant for Low Ambient Light
|
Infinite
Outstanding
|
Infinite
Outstanding
|
Infinite
Outstanding
|
Only relevant for Low Ambient Light,
which is seldom the case for mobile
devices.
|
|
High Brightness Mode
Automatic Brightness in High Ambient
Light
|
|
Measured High Brightness Mode
50% Average Picture Level
|
High
Brightness Mode
969 cd/m2
Excellent
|
High
Brightness Mode
719 cd/m2
Excellent
|
High
Brightness Mode
717 cd/m2
Excellent
|
This is the Brightness for typical
screen content
that has a 50% Average Picture Level.
|
|
Measured High Brightness Mode
100% Full screen White
|
High
Brightness Mode
800 cd/m2
Excellent
|
High
Brightness Mode
764 cd/m2
Excellent
|
High
Brightness Mode
764 cd/m2
Excellent
|
This is the Brightness for a screen that
is entirely
all white with 100% Average Picture
Level.
|
|
Measured High Brightness Mode
1% Average Picture Level
|
High
Brightness Mode
1,360 cd/m2
Excellent
|
High
Brightness Mode
669 cd/m2
Excellent
|
High
Brightness Mode
666 cd/m2
Excellent
|
This is the Peak Brightness for a screen
that
has only a small 1% Average Picture
Level.
|
|
High Ambient Light Contrast Rating
|
|
Contrast Rating
for High Ambient Light
The Higher the Better
for Screen Readability
in High Ambient Light
|
114 – 167
With Manual
Brightness
Very Good
182 – 309
High
Brightness Mode
Excellent
|
104 – 110
With Manual
Brightness
Very Good
152 – 174
High
Brightness Mode
Excellent
|
104 – 111
With Manual
Brightness
Very Good
151 – 174
High Brightness
Mode
Excellent
|
Depends on the Screen Reflectance and
Brightness.
Defined as Maximum Brightness / Average Reflectance.
The display’s actual on-screen Contrast
Ratio
changes with the Ambient Light lux level
and
is proportional to the Contrast Rating.
|
|
Screen Readability
in High Ambient Light
|
Very Good A
With Manual
Brightness
Excellent A+
With Auto
Brightness On
|
Very Good A
With Manual
Brightness
Excellent A+
With Auto
Brightness On
|
Very Good A
With Manual
Brightness
Excellent A+
With Auto
Brightness On
|
Indicates how easy it is to read the
screen
under High Ambient Lighting. Depends on
both the Screen Reflectance and
Brightness.
See High
Ambient Light Screen Shots
|
|
Colors and Intensities
The Color Gamut, Intensity Scale, and White
Point determine the quality and accuracy of all displayed images and
all
the image colors. Bigger is definitely Not Better
because the display needs to match all the Standards that were used
when the content was produced.
|
Categories
|
Vivid
mode
Wide Color
Gamut
|
Cinematic
mode
DCI-P3
Content
|
Gentle
mode
sRGB
Content
|
Comments
|
|
Color of White
Color Temperature in degrees
Measured in the dark at 0 lux
See Figure 1
|
7,500 K
2.8 JNCD
from D65 White
User
Adjustable
from 6,500
K to 9,600 K
Intentionally
Bluish Mode
|
6,510 K
0.4 JNCD
from D65 White
Very Close
to Standard
Accurate
DCI-P3 Content
See Figure 1
|
6,510 K
0.4 JNCD
from D65 White
Very Close
to Standard
Accurate
sRGB Content
See Figure 1
|
D65 with 6,500 K is the standard color
of White
for most Consumer Content and needed for
accurate color reproduction of all
images.
JNCD is a Just Noticeable Color Difference.
White Point accuracy is more critical than
other colors.
See Figure 1
for the plotted White Points.
See Figure 2 for the
definition of JNCD.
|
|
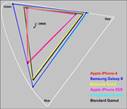
Color Gamut
Measured in the dark at 0 lux
See Figure 1
|
99 percent
DCI-P3
Cinema Gamut
Intentionally
Vivid Colors
Wide Color
Gamut Mode
124
percent
sRGB /
Rec.709 Gamut
Intentionally
Vivid Colors
Wide Color
Gamut Mode
See Figure 1
|
101
percent
DCI-P3
Cinema Gamut
Very Close
to Standard
Accurate
DCI-P3 Content
See Figure 1
|
102
percent
sRGB /
Rec.709 Gamut
Very Close
to Standard
Accurate
sRGB Content
See Figure 1
|
Most current consumer content uses sRGB /
Rec.709.
The new 4K UHD TVs and Digital Cinema use
DCI-P3.
A Wide Color Gamut is useful in High
Ambient Light
and for some applications. It can be used
with Color
Management to dynamically change the
Gamut.
See Figure 1
|
|
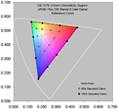
Absolute Color Accuracy
|
|
Absolute Color Accuracy
Average Color Error at 0 lux
For 41 Reference Colors
Just Noticeable Color Difference
See Figure 2
|
Average Color Error
From sRGB
/ Rec.709
Δ(u’v’)
= 0.0155
3.9 JNCD
Intentionally
Vivid Colors
Wide Color
Gamut Mode
See Figure 2
|
Average Color Error
From
DCI-P3
Δ(u’v’)
= 0.0015
0.4 JNCD
Excellent
Accuracy
Accurate
DCI-P3 Content
See Figure 2
|
Average Color Error
From sRGB
/ Rec.709
Δ(u’v’)
= 0.0015
0.4 JNCD
Excellent
Accuracy
Accurate
sRGB Content
See Figure 2
|
JNCD is a Just Noticeable Color Difference.
See Figure 2 for the
definition of JNCD and for the
Accuracy Plots showing
the measured Color Errors.
Color Errors below 3.5 JNCD are Very
Good.
Color Errors 3.5 to 7.0 JNCD are
Good.
Color Errors above 7.0 JNCD are
Poor.
|
|
Absolute Color Accuracy
Largest Color Error at 0 lux
For 41 Reference Colors
Just Noticeable Color Difference
See Figure 2
|
Largest Color Error
From sRGB
/ Rec.709
Δ(u’v’)
= 0.0408
10.2 JNCD
for 100%
Red
Intentionally
Vivid Colors
Wide Color
Gamut Mode
See Figure 2
|
Largest Color Error
From
DCI-P3
Δ(u’v’)
= 0.0030
0.8 JNCD
for 100%
Cyan-Blue
Excellent
Accuracy
Accurate
DCI-P3 Content
See Figure 2
|
Largest Color Error
From sRGB
/ Rec.709
Δ(u’v’)
= 0.0032
0.8 JNCD
for 100%
Yellow-Red
Excellent
Accuracy
Accurate
sRGB Content
See Figure 2
|
JNCD is a Just Noticeable Color Difference.
See Figure 2 for the
definition of JNCD and for the
Accuracy Plots showing
the measured Color Errors.
Color Errors below 3.5 JNCD are Very
Good.
Color Errors 3.5 to 7.0 JNCD are
Good.
Color Errors above 7.0 JNCD are
Poor.
|
|
Changes in Absolute Color Accuracy with Average Picture Level APL
Measured Shifts in the Absolute Color Accuracy with Image Content
from Low 1% APL to High 50% APL
|
|
Shift in the Color of White
Just Noticeable Color Difference
See Figure 4
|
White Point
Color Shift
from Low
to High APL
Δ(u’v’)
= 0.0012
0.3 JNCD
Excellent
|
White Point
Color Shift
from Low
to High APL
Δ(u’v’)
= 0.0003
0.1 JNCD
Excellent
See Figure 4
|
White Point
Color Shift
from Low
to High APL
Δ(u’v’)
= 0.0003
0.1 JNCD
Excellent
See Figure 4
|
JNCD is a Just Noticeable Color Difference
See Figure 2 for the
definition of JNCD.
See Figure 4 for the
measured Color Shifts.
Color Shifts below 3.5 JNCD are Very
Good.
Color Shifts 3.5 to 7.0 JNCD are
Good.
Color Shifts above 7.0 JNCD are
Poor.
|
|
Average Color Shift
For 41 Reference Colors
Just Noticeable Color Difference
See Figure 4
|
Vivid mode
Intentionally
Variable
|
Average
Color Shift
from Low
to High APL
Δ(u’v’)
= 0.0006
0.2 JNCD
Excellent
See Figure 4
|
Average
Color Shift
from Low
to High APL
Δ(u’v’)
= 0.0006
0.2 JNCD
Excellent
See Figure 4
|
JNCD is a Just Noticeable Color Difference.
See Figure 2 for the
definition of JNCD.
See Figure 4 for the
measured Color Shifts.
Color Shifts below 3.5 JNCD are Very
Good.
Color Shifts 3.5 to 7.0 JNCD are
Good.
Color Shifts above 7.0 JNCD are
Poor.
|
|
Largest Color Shift
For 41 Reference Colors
Just Noticeable Color Difference
See Figure 4
|
Vivid mode
Intentionally
Variable
|
Largest Color Shift
from Low
to High APL
Δ(u’v’)
= 0.0012
0.3 JNCD
for 75%
Blue-Magenta
Excellent
See Figure 4
|
Largest Color Shift
from Low
to High APL
Δ(u’v’)
= 0.0016
0.4 JNCD
for 100%
Magenta-Red
Excellent
See Figure 4
|
JNCD is a Just Noticeable Color Difference
See Figure 2 for the
definition of JNCD.
See Figure 4 for the
measured Color Shifts.
Color Shifts below 3.5 JNCD are Very
Good.
Color Shifts 3.5 to 7.0 JNCD are
Good.
Color Shifts above 7.0 JNCD are
Poor.
|
|
|
|
Dynamic Brightness
Change in Luminance with
Average Picture Level APL
|
32 percent
Decrease
Intentionally
Large
|
6 percent
Decrease
Very Good
|
6 percent
Decrease
Very Good
|
This is the percent Brightness decrease
with APL
Average Picture Level. Ideally should be
0 percent.
|
|
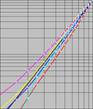
Intensity Scale and
Image Contrast
See Figure 3
|
Smooth and
Straight
Very Good
Slightly
Too Steep
See Figure 3
|
Very
Smooth and Straight
Excellent
Very
Accurate
See Figure 3
|
Very
Smooth and Straight
Excellent
Very
Accurate
See Figure 3
|
The Intensity Scale controls image
contrast needed
for accurate Image Contrast and Color
reproduction.
See Figure 3
|
|
Gamma for the Intensity Scale
Larger has more Image Contrast
See Figure 3
|
2.37
Very Good
Gamma
Intentionally High
|
2.20
Excellent
Gamma Very
Accurate
|
2.21
Excellent
Gamma Very
Accurate
|
Gamma is the log slope of the Intensity
Scale.
Gamma of 2.20 is the standard and needed
for
accurate Image Contrast and Color reproduction.
See Figure 3
|
|
Image Contrast Accuracy
|
Very Good
|
Excellent
|
Excellent
|
See Figure 3
|
|
Viewing Angles
The variation of
Brightness, Contrast, and Color with Viewing Angle is especially important
for Smartphones because
of their larger screen
and multiple viewers. The typical manufacturer 176+ degree specification for
LCD Viewing Angle
is nonsense because that
is where the Contrast Ratio falls to a miniscule 10. For most LCDs there are
substantial
degradations at less
than ±30 degrees, which is not an atypical Viewing Angle for Smartphones and
Tablets.
The
Viewing Angle variations are essentially identical for all of the OPPO Find
X2 Screen Modes.
Note
that the Viewing Angle performance is also very important for a single viewer
because the Viewing Angle can vary
significantly
based on how the Smartphone is held. The Viewing Angle can be very large if
resting on a table or desk.
The OPPO Find X2 display has
a Brightness (Luminance) fall off with Viewing Angle that is much smaller
than the best LCD displays.
The White Point Color Shift is
the most viewer noticeable Color Shift with Viewing Angle because it is often
the screen background.
Blue
Color Shifts are less visually noticeable than the Red and Green Color Shifts
found in many Smartphone displays.
Note
that we now list the Color Shifts for each individual Primary Color instead
of only listing the Maximum Color Shift,
which
had up to a higher 5.0 JNCD threshold for receiving a Very Good Green Rating.
With the new 3.5 JNCD metric
almost
all current model OLED Smartphone Displays would receive a Yellow Rating for
one or more of the Primary Colors.
The
Color Shifts for the OPPO Find X2 are all Small to Medium and all receive
Very Good to Excellent Green Ratings.
|
Categories
|
Vivid
mode
Wide Color
Gamut
|
Cinematic
mode
DCI-P3
Content
|
Gentle
mode
sRGB
Content
|
Comments
|
|
Brightness Decrease
at a 30 degree Viewing Angle
|
23 percent
Decrease
Small
Decrease
Very Good
|
Most screens become less bright when
tilted.
LCD decrease is generally greater than 50
percent.
|
|
Contrast Ratio at 0 lux
at a 30 degree Viewing Angle
|
Infinite
Contrast Ratio
Outstanding
|
A measure of screen readability when the
screen
is tilted under low ambient lighting.
|
|
White Point Color Shift
at a 30 degree Viewing Angle
|
Small Color
Shift
Δ(u’v’)
= 0.0040
1.0 JNCD
Excellent
|
JNCD is a Just Noticeable Color Difference.
See Figure 2 for the
definition of JNCD.
Color Shifts below 3.5 JNCD are Very
Good.
|
|
Color Shifts for the Primaries
|
|
Red Primary Color Shift
at a 30 degree Viewing Angle
|
Small Color
Shift
Δ(u’v’)
= 0.0103
2.6 JNCD
Very Good
|
JNCD is a Just Noticeable Color Difference.
See Figure 2 for the
definition of JNCD.
Color Shifts below 3.5 JNCD are Very
Good.
|
|
Green Primary Color Shift
at a 30 degree Viewing Angle
|
Small Color
Shift
Δ(u’v’)
= 0.0064
1.6 JNCD
Excellent
|
JNCD is a Just Noticeable Color Difference.
See Figure 2 for the
definition of JNCD.
Color Shifts below 3.5 JNCD are Very
Good.
|
|
Blue Primary Color Shift
at a 30 degree Viewing Angle
|
Medium
Color Shift
Δ(u’v’)
= 0.0137
3.4 JNCD
Very Good
|
JNCD is a Just Noticeable Color Difference.
See Figure 2 for the
definition of JNCD.
Color Shifts below 3.5 JNCD are Very
Good.
|
|
|
|
Color Shifts for Color Mixtures
at a 30 degree Viewing Angle
Reference Brown (255, 128, 0)
|
Small
Color Shift
Δ(u’v’)
= 0.0024
0.6 JNCD
Excellent
|
JNCD is a Just Noticeable Color Difference.
Color Shifts for non-IPS LCDs are about 10
JNCD.
Reference Brown is a good indicator of
color shifts
with angle because of unequal drive
levels and
roughly equal luminance contributions
from Red
and Green. See Figure 2 for the
definition of JNCD.
|
|
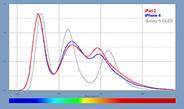
Display Spectra
The Display Spectra for the Screen Modes and for the Eye Care Night Mode are measured in Figure 5 below.
The Eye Care Night Mode is designed to change
the color balance of the display in order to reduce the amount of Blue Light
produced by the display,
which some recent research indicates can affect how well users sleep
afterwards.
|