2016 LG OLED TV Display Technology Shoot-Out
Dr. Raymond M. Soneira
President, DisplayMate Technologies
Corporation
Copyright © 1990-2016 by DisplayMate
Technologies Corporation. All Rights Reserved.
This article, or any part
thereof, may not be copied, reproduced, mirrored, distributed or incorporated
into any other work without
the prior written permission of DisplayMate Technologies Corporation
|
2016 LG OLED TV
|
Introduction
Over the last 75 years
there have been only four display technologies that have been developed and
used in the production of direct-view TVs. They are: CRT, LCD, Plasma, and
OLED, in historical order. But as new technologies evolved over time others
became no longer competitive. For CRTs, which ruled during the 20th century, TV
production came to an end about 10 years ago, and for Plasma TVs, production
ended in 2014. Rear projection TVs with DLP and LCoS technology also
disappeared within the last 10 years. Each failed as the result of the intense
competition from LCDs, which now account for most of the displays used in
products from smartphones to TVs.
However, starting in
2010, a new display technology called OLED (for Organic Light Emitting Diodes,
not to be confused with LEDs) made a dramatic entrance for smartphone displays.
Over the last 6 years OLEDs have improved at a very impressive rate so they now
frequently exceed the performance of the best LCDs in smartphones. TVs are much
larger and much more challenging to manufacture, so OLED TVs arrived later. The
first OLED TVs launched in 2013 to impressive rave reviews.
For consumers, the new
OLED TVs are the natural successors to replace their previous or aging Plasma
and CRT TVs because they provide even better perfect Black Levels and Infinite
Contrast Ratios for accurately reproducing dark picture content. OLEDs have a
unique set of native strengths and performance advantages that contrast and
compete with LCD’s own unique set of native strengths and performance
advantages. We’ll cover these issues including comparisons between both
technologies.
What’s New
For 2016 the latest
high-end TVs are now 3 TVs in One
because they need to show Picture Content from 3 different TV Standards: 2K Full HD TV Content,
and 4K Ultra HD TV Content, and the new HDR
High Dynamic Range TV Content. We
will cover each of these in turn...
Article Overview
In this article we will
scientifically examine, measure and analyze in-depth the display performance
and picture quality of the new 2016 third generation OLED TV from LG with a 65
inch screen, including the new 4K Ultra HD and HDR High Dynamic Range modes,
and also compare OLED to LCD TV performance in a number of key areas.
The article is divided into the following major sections:
• OLED and
LCD Technology Background
• HDR High Dynamic
Range TVs
• OLED TV
Results Highlights with LCD Performance Comparisons
• OLED TV
Conclusions
• OLED TV Lab
Measurements and Comparison Table
OLED and LCD Technology Background
First we’ll provide some background information on OLED and LCD
technology, and then discuss the native strengths of each TV technology.
There are No LED TVs!
There is still a lot of consumer confusion regarding LED TVs versus OLED
TVs… The first thing we need to clear up is the widespread misunderstanding
created by the marketing of “LED TVs” – there aren’t any! The so-called LED TVs
are just LCD TVs that have a backlight that is made of white LED lights. The
LEDs are not the display, just the backlight, nothing more! OLEDs are an
entirely different class of emissive imaging display technology (that doesn’t
use a backlight). Unfortunately, many people think they already have an LED TV
or OLED TV at home, but they actually have an LCD TV…
OLED TV Display Technology
OLEDs are thin solid
state devices that directly emit colored light. OLED
displays have been improving rapidly with increasing screen size, peak
brightness, color gamut, and power efficiency. They don’t need a
backlight and supporting optical components. As a result, OLED TVs are
considerably thinner (with the TV screen just 0.2 inches deep and the OLED
panel itself only 0.1 inches deep for this 65 inch model) and are considerably
lighter than LCD TVs. OLED displays are also rimless, with the picture going right
to the edge of the panel without a visible outer bezel. It is also easier to
make OLED TVs with curved screens, which we discuss below.
Because the
OLED sub-pixels are all individually electrically powered to emit light, they
can produce perfect Black Levels (by staying off) and accurately reproduce very
dark picture content, which is a major competitive advantage for OLEDs. Plasma
and CRT TVs were also particularly good with Black Levels and dark picture
content, so OLED TVs are the natural successors to the former Plasma and CRT TV
markets, and actually perform significantly better than them.
OLED
displays first appeared in consumer products in 2010 on smartphones with small
4 inch screens. Making a large TV size OLED display is considerably more challenging,
so that took a few years more. LG introduced their first generation 55 inch
Full HD OLED TV in 2013, which was the best TV display we had ever tested up to
that time – and virtually all reviewers agreed that OLED TVs outperformed the
best Plasma and LCD TVs in producing the very highest picture quality preferred
by both reviewers and videophile consumers. The 2016 model that we test here is
LG’s third generation OLED TV.
LG has implemented some
special OLED technology for their TVs. Rather than laying out three separate
sets of OLED Red, Green, and Blue sub-pixels throughout the screen, the LG TV
instead has a single uniform set of OLED White sub-pixels throughout made as a
combined stack of Red, Green, and Blue OLED colors for each sub-pixel. The
sub-pixels then each have their own individual Red, Green and Blue color
filters that select the specific Red, Green or Blue OLED color for that
sub-pixel. This approach greatly simplifies the OLED production, improves
yields, and lowers the manufacturing costs. In addition, LG has also added a
4th clear sub-pixel to every pixel that just produces pure White. This
increases the display’s power efficiency and also improves color accuracy and
color management.
LCD TV Display Technology
LCDs have dominated the
TV market for over 10 years. LCDs all have a separate backlight of LEDs that
illuminate the LCD panel from behind. The LCD panel produces its picture by
controlling the amount of light that is transmitted through every sub-pixel on
the screen. With a separate backlight it is easier to significantly increase
the TV Brightness, which is a major competitive advantage for LCDs.
However, LCDs have
trouble producing Black Levels and dark picture content because they have
native Contrast Ratios of only 1,000 to 4,000, so they are unable to completely
block all of the backlight when trying to produce Black or low light levels for
dark picture content. This can result in a noticeable dark gray background
surrounding and within picture content, which also reduces both the image
contrast and the color saturation of dark picture content.
To improve Black and
dark picture content, high-end LCDs utilize Local
Dimming of the backlight, which reduces the LED backlights in regions of
overall darker content implemented in real-time from frame-to-frame. But those
regions are then unable to reproduce any bright sub-pixel content anywhere
within the same region. In addition, adjacent regions need to have similar
Local Dimming levels to reduce any discernable patchiness across the screen. So
there are a complex set of compromises for Local Dimming that need to be made
real-time from frame-to-frame. We’ll examine Local
Dimming in more detail below.
The latest high-end LCD
TVs also have Quantum Dots, which can efficiently produce the very saturated
Primary Colors that are required for 4K and HDR picture content.
Flat and Curved Screen TVs
Both OLED and LCD TVs now come in both flat screen and
curved screen models. For 2016 we tested a flat screen OLED model, however in
2015 and 2013 we tested curved screens. For curved screen TVs it is very
important to note that the curvature is actually relatively small, only about
2.1 inches (5.3 cm) in-depth (from the edge to the screen center) on a 65 inch
OLED TV – the curvature is not that noticeable. That slight curvature has a
real purpose – it significantly reduces the reflections of ambient light from
the screen, which improves image contrast and the appearance of dark picture
content. The slight curvature also reduces the (keystone) visual picture
distortion that viewers see in the screen image geometry with a perfectly flat
screen TV, both from the central Sweet Spot and also at larger viewing angles.
Because the screen curvature is small, it is barely
noticeable when watching the screen from normal viewing distances, particularly
in low ambient light, which is ideal for watching TV. Since we are all
accustomed to watching perfectly flat screens some people don’t like the change
in screen geometry (even though curved screens actually show less visual
geometric distortion than flat screens). Note that flat screen TVs are easier
to wall mount, and curved screen TVs are easier to place on furniture.
Fortunately many high-end TVs are available with either curved or flat screens.
Whether you prefer a curved or flat screen is primarily subjective, but a
slightly curved screen does provide several important objective optimal visual
advantages, which are explained in detail in this earlier article.
OLED TV versus LCD TV
Performance
Both OLEDs and LCDs can produce excellent
state-of-the-art TV displays. But OLED and LCD technologies have different
inherent native strengths and weaknesses, so neither display technology wins in
all situations and all viewing conditions.
• LCD’s inherent strengths favor
overall brighter picture content under medium to high ambient light viewing
conditions because they have native higher Peak Luminance, but they also have
much higher native Black Levels and much lower native Contrast Ratios than
OLEDs.
• OLED’s inherent strengths favor low
to medium ambient light viewing conditions because they have perfect native
Black Levels and Infinite Contrast Ratios, but they also have lower native Peak
Luminance than LCDs.
Both display technologies
continue to work hard to enhance their native strengths and minimize their
native weaknesses in order to appeal to the widest possible audience, viewing
conditions, and picture content.
• For LCD TVs, the main challenge is
to lower their Black Level, which is accomplished by Dimming the brightness of
the LCD backlight when the picture content is darker. That lowers the Black
Level but that also lowers the Peak Luminance at the same time.
The underlying issue is that both bright and dark picture
content are often close to one another, so backlight compromises that favor
either Black or Bright are required. Some LCD TVs apply Dimming to the entire
full screen backlight, but all high-end LCDs now use Local
Dimming that divides the screen into as many zones as possible. Then
each backlight zone is adjusted real-time and frame-to-frame according to the
picture content within that zone and adjacent zones. The more zones the better.
We examine the issues and consequences of Local Dimming below.
For watching TV in higher
ambient lighting, the typically higher native picture brightness of LCD TVs
helps to raise the picture quality that is washed out by ambient light falling
on the screen, which reduces both color saturation and picture contrast. Under
these less than ideal viewing conditions the brighter the picture the better it
will look in ambient light, but the best TV picture quality will always be in
the lowest possible amount of ambient light.
• For OLED TVs, the main challenge is to improve
their Peak Luminance, which has been steadily increasing. The underlying issue
is that every sub-pixel in an OLED display is directly powered with electrical
current to emit its light. Higher brightness requires more power, so the
display backplane must be able to carry high current levels for all 33 million
sub-pixels that emit light.
The key to appreciating and
seeing the very best outstanding picture quality that OLED TVs can deliver is
by watching TV in as low as possible ambient lighting, because any light that
falls and reflects off the screen will wash out its stunning picture contrast
from the perfect Black Levels and Infinite Contrast Ratio. In low ambient light
the OLED picture contrast and colors are absolutely stunning, and the picture
quality incredible!
3 TVs in One
The latest high-end TVs are now actually 3 TVs in One because they need to show Picture Content from 3 different
TV Standards:
1. 2K Full HD TV Content
2. 4K Ultra HD TV
Content
3. HDR High Dynamic
Range Content
We lab test and analyze the performance of all 3 TV Content
Standards for the LG OLED TV below.
2K Full HD High Definition TV Content
If you have a reasonably up-to-date TV purchased within the last 5
years, you most likely have a 2K Full HD 1920x1080 pixel resolution flat screen
LCD or Plasma TV with an sRGB / Rec.709 Color Gamut Standard. Most existing TV
content is for the Full HD resolution and Color Gamut. This content not only
includes Over The Air (OTA), Cable, and Satellite TV broadcasting, but also
Blu-ray, DVD, digital camera, web content, internet streaming, and computer
content, including photos, videos and movies, which are all based on the sRGB /
Rec.709 Color Gamut Standard. Since most existing TV
Content is based on 2K Full HD, any TV that you buy now or in the near future
will need to support and accurately display Full HD content with an sRGB /
Rec.709 Color Gamut.
4K UHD Ultra High Definition TV Content
The newest TVs have an Ultra HD 3840x2160 pixel resolution, also called
4K, which is twice the resolution of Full HD and has 4 times the number of
pixels. They have a new wider DCI-P3 (Digital Cinema Initiative) Color Gamut Standard that is 26 percent larger
than the current sRGB / Rec.709 Color Gamut, with more saturated Red and Green
Primaries that provide noticeably richer and vibrant accurate picture color
content. However, many 4K Ultra HD TVs do not have a full DCI-P3 Color Gamut.
All 4K Ultra HD TVs also need to accurately show the extremely large
base of existing 2K Full HD picture content, which has a different Color Gamut
in addition to a smaller resolution. We have fully lab tested both the 2K Full
HD and 4K Ultra HD modes for accuracy and picture quality.
HDR High Dynamic Range TVs
High Dynamic Range, HDR,
is the latest state-of-the-art enhanced 4K TV performance standard that was
introduced this year at the 2016 Consumer Electronics Show in January by the
UHD Alliance, an industry consortium. TVs, Blu-ray players, and content that
meet their standard receive a Ultra HD Premium
HDR certification, Right now there is still only a relatively small amount of
HDR content, but it is starting to grow rapidly with both 4K Blu-ray titles and
4K streaming from Amazon, Netflix, Vudu, and others. Dolby Vision is another
competing HDR standard. The 2016 LG OLED TVs all support both HDR and Dolby
Vision. The discussion below is for the Ultra HD Premium HDR Standard.
HDR is designed to
provide an enhanced TV viewing visual experience by providing much brighter
picture content highlights, and also providing much better rendering and shadow
detail for darker picture content.
Brightest Picture Content: HDR is
designed to add pizzazz to video content by significantly increasing the TV's
peak Brightness for some portions of the brightest picture content. The Peak
Brightness (Luminance) for TVs supporting the new HDR standard must exceed 540
nits for OLED TVs and 1,000 nits for LCD TVs, but only for a small fraction of
the entire picture for a fraction of the time. This is not about having a
brighter TV, but about being able to add bright highlights to the picture. It’s
meant to be like icing on a cake – don't over do it...
Dark Picture Content: Another
requirement for High Dynamic Range is accurately reproducing Dark Picture
Content in addition to Bright Picture Content, and more importantly being able
to simultaneously do both Bright and Dark Picture Content at the same time on
any image being displayed. The Black Level requirement for the new HDR standard
is less than 0.05 nits for LCD TVs, and less than 0.0005 nits for OLED TVs,
which is 100 times lower than for LCDs. OLED TVs can already do this because of
their Infinite Contrast Ratios and Perfect Black Levels. However, LCD TVs only
have native Contrast Ratios from 1,000 to 4,000, which limits their ability to
show dark picture content, and HDR requires a minimum Contrast Ratio of 20,000
for Ultra HD Premium. So LCDs need to implement Local Dimming and other
advanced picture processing in order to achieve their High Dynamic Range Black
Level requirement. We’ll examine Local Dimming in more detail below.
Color Gamut: The current minimum
recommended HDR Color Gamut is 100 percent of DCI-P3, but the minimum for Ultra HD Premium certification is 90 percent of DCI-P3.
HDR versus Vivid modes: Many older TVs
already extend the Dynamic Range of all picture content in Vivid picture modes
with Dynamic Brightness and Contrast, and other "advanced" picture
"enhancements" that many manufacturers advertise. This often leads to
significantly exaggerated colors and contrast. What makes HDR totally different
and considerably better is that it is a production standard implemented by the
content producers when they are making their content – they add the HDR effects
that they want you to see on their content. It is then up to the TV hardware to
implement the HDR effects encoded into the picture content by the content
producers.
The Content Producers: So the success of
HDR will depend how well the content producers use it. One major reason why 3D
TV fizzled is that the content producers did a poor job of 3D, particularly
with the exaggerated in your face 3D effects. Hopefully, HDR will be used
appropriately and nicely to add interesting bright highlights to the picture
content. It is totally up to the content producers. Right now there is still
only a relatively small amount of HDR content, but it is starting to grow
rapidly, so we'll see...
HDR Metadata and EOTFs
All HDR content includes additional information encoded
into the TV signal called Metadata, where the content producer specifies how to
properly reproduce their content. HDR content can specify Peak Brightness
levels all the way up to a dazzling 10,000 nits, although no current TV is
capable of reaching that level. So each TV needs to make a number of
adjustments to better match its performance capabilities with those specified
by the producer of the content.
All Picture Content consists of a string of digital data
together with instructions on how to convert the numerical data values into
Brightness (nits) for every sub-pixel on the screen. For all pre-HDR content
(referred to as SDR for Standard Dynamic Range), this is accomplished with an
Industry Standard fixed Intensity Scale, often
called a Gamma curve, which every TV must produce in order to deliver an
accurate picture. For HDR content this has been extended into a more
generalized and variable Electro-Optical Transfer
Function, EOTF.
The content producer specifies the EOTF that they want, and then the TV adjusts
that EOTF to provide a match to its performance capabilities, making a series
of compromises to deliver the best overall rendering of the content, which is
called Tone Mapping.
However, for any
particular picture content, there are many different possible strategies and compromises
for adjusting the EOTF and Tone Mapping for any particular TV, so the end
result will depend on the particular choices selected by the TV software, and
also by the viewer, if the manufacturer provides user adjustments so they can
vary the EOTF and Tone Mapping according to their own viewing preferences. We’ll examine this in more detail below.
SDR Intensity Scale versus
HDR EOTF Performance
There are several very important differences between the
SDR Intensity Scale and the HDR EOTF:
• The SDR Intensity Scale is fixed and set from
the top with the Brightest Peak Luminance level – then all darker image content
all the way down to the Black Level are set with respect to the Peak Luminance
level. However, this reduces the rendering accuracy of the darker picture
content, as explained next.
• SDR content generally has 8-bits, which has
256 digital intensity levels. That provides a range of 200,000:1 in Luminance
for each primary color, which would appear to be more than adequate. However,
with this approach the digital granularity between adjacent Brightness levels
gets systematically worse for dimmer image content. For example, the digital
granularity step size at the relatively dark digital picture level of 32 is 8
times the Luminance step size and digital granularity that exists at the
brightest digital picture level of 255. This much larger granularity may become
noticeable as visible false contouring of color and brightness for dimmer image
content, and this effect will become more noticeable as the Peak Luminance is
increased.
• The HDR EOTF is variable and instead set from
the bottom Black Level (effectively 0 Luminance) – then all brighter image
content levels increase from the Black Level up to whatever specific Peak
Luminance the TV display can produce. This significantly reduces the digital
granularity of the lower levels and improves the rendering and accuracy of dark
picture content. This is particularly beneficial for
OLED TVs because they are exceptionally good at rendering dark image content.
• HDR content has at least 10-bits, which has
1,024 intensity levels or more. That produces at least 4 times the number of
levels that SDR with 8-bits provides. But it is even better, because unlike the
fixed Intensity Scale, the variable EOTF is based on Perceptual
Quantization (PQ) from visual Just Noticeable
Differences (JND), so it optimizes and reduces the digital granularity
for both the darkest and brightest picture content.
As a result, HDR content is able
to produce much higher quality picture content at both the very dark and very
bright extremes.
HDR Capable Components
In addition to a 4K HDR capable TV you also need additional components
to display the new HDR content, such as a 4K HDR capable Blu-ray player. In
addition, HDR capable set top boxes and streaming services will need to
implement the new HDMI 2.0a standard in order to be able to transmit the HDR
enhanced picture content. The previous generation 2K Full HD TVs needed HDMI
1.4. The new 4K TVs and associated electronics need HDMI 2.0, a significant
upgrade due to the much higher bandwidth needed for 4K. The upgrade from HDMI
2.0 to 2.0a will mostly likely be done through downloadable firmware and
software upgrades.
The Display Shoot-Out
For
this article we lab tested a retail production 65 inch flat screen 4K LG OLED
TV, model 65E6. All of the 2016 LG TV models use the same OLED panels. The LG
OLED TVs come in 55, 65, and 77 inch screen sizes, with both flat screen and
curved screen models (and other options like high-end audio and speakers).
In
June 2016 at the SID Display Week Conference,
the display industry’s premier annual event, the 77 inch model of the LG OLED
TV won a “Best in Show Award” chosen for “the
ability to generate excitement within the display industry” so the LG OLED TV
impressed many experts in the display industry.
To examine the display
performance of the LG OLED TV we ran our in-depth series of Display Technology Shoot-Out
Lab tests and measurements in order to determine how the latest OLED TV
displays have improved. We take display quality very seriously and provide
in-depth objective analysis based on detailed laboratory tests and measurements
and extensive viewing tests with both test patterns, test images and test
photos.
We’ll cover all of the
above issues and much more, with in-depth comprehensive display tests,
measurements and analysis that you will find nowhere else.
Results Highlights
In this section we review and also explain the principal
results from the DisplayMate Lab tests and measurements covered in the Display
Shoot-Out Comparison Table under the following categories: Display
Specifications, Screen
Reflections, Brightness
and Contrast, Colors
and Intensities, Absolute
Color Accuracy, Absolute
Luminance Accuracy, Viewing
Angles, Display
Light Spectra.
This Results Highlights section
has extensive background information and analysis for the LG OLED TV display.
You can skip these Results Highlights and go directly to
the LG
OLED TV Conclusions for a more brief performance summary and analysis.
Topics Covered in Results
Highlights
The Results Highlights section includes the following
topics:
• TV Picture Modes
• Two Standard Color Gamuts
• High Picture Quality and Accuracy Measurements and
Analysis
Absolute Color Accuracy
Absolute Luminance Accuracy
Intensity Scales and Image Contrast Accuracy
• Picture Brightness and Contrast
Measurements and Analysis
Picture Brightness
Low Screen Reflectance
Picture Black Levels and Contrast Ratio
• SDR and HDR Viewing Tests and Measurements and Analysis
Full HD Content Viewing Tests
HDR High Dynamic Range Modes
Ultra HD and HDR Viewing Tests
LCD Local Dimming
Variations with Viewing Angle and Position
Response Time and Motion Blur
TV Picture Modes
All high-end TVs include a number of user selectable
Picture Modes, each with different intended viewing conditions and applications
that provide different color, brightness, contrast and calibration settings,
and selectable picture processing options. The LG OLED TV has 8 selectable
Picture modes, plus 3 selectable HDR modes, and 3 selectable Dolby Vision
modes.
We will analyze three of the most important Picture
Modes: the native display mode that delivers the highest brightness, contrast,
and color saturation, called the Vivid mode, and the two Cinema modes that
deliver the most accurate colors and picture quality for the Normal Rec.709 2K
Full HD content, and the Wide DCI-P3 4K Ultra HD content. We also measure the 3
HDR modes, which are HDR Standard, HDR Bright, and HDR Vivid.
For all of the tests and measurements we used the default
factory settings for each of the modes and did not make any additional changes
or adjustments.
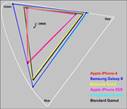
Two Standard TV Color Gamuts
The OLED TV fully supports two important standard Color
Gamuts, the new DCI-P3 Wide Color Gamut that is used in 4K Ultra HD TVs,
Digital Cinema and HDR, and also the traditional smaller sRGB / Rec.709 Color
Gamut that is used for producing virtually all current
TV content including Over The Air (OTA), Cable, and Satellite TV
broadcasting, but also Blu-ray, DVD, digital camera, web content, internet
streaming, and computer content, including photos, videos and movies.
Measurements: Since the
TV supports two Color Gamuts it needs to implement Color Management in order to
get the second smaller sRGB / Rec.709 Gamut to also appear correctly, which is
generated from the wider native DCI-P3. Each LG OLED TV display is individually
calibrated at the factory. The OLED TV has an accurate 98-102 percent of the
wide DCI-P3 Wide Color Gamut, and an accurate 108 percent of the sRGB / Rec.709
Color Gamut. See this Figure
and the Colors
and Intensities section for the measured Color Gamuts.
High Picture Quality and
Accuracy
The next series of Lab Tests
and Measurements analyze the Picture Quality and Accuracy. Each LG OLED
TV display is individually calibrated at the factory for maximum accuracy.
In order to produce high
picture quality, a TV display needs to produce Accurate
Colors, plus Accurate
Luminance for all colors, and also have an Accurate Intensity Scale.
We examine each of these in detail next. Since the eye judges Color,
Brightness, and Contrast separately, they also need to be measured separately.
All three are required in order to deliver accurate and beautiful pictures. First
we will analyze the Lab Measurements and then look at some challenging picture
content in the Viewing Tests sections below.
Absolute Color Accuracy
Delivering great color with high Absolute Color Accuracy
is incredibly difficult because everything on the display has to be done just
right. In order to deliver accurate image colors, a display needs to closely
match the standard Color Gamut that was used for producing the content being
viewed – not larger and not smaller. In addition the display also needs an
accurate (pure logarithmic power-law) Intensity Scale, and an accurate White
Point.
Color Accuracy is particularly important for TVs, and
their accuracy has been steadily improving as the result of many manufacturers,
including LG, using fully automated color calibration with instruments at the
factory instead of having assembly workers visually tweaking the colors.
Since the LG OLED TV supports two Color Gamuts it needs
to also implement Color Management in order to get the second smaller sRGB / Rec.709
Gamut to also appear correctly, which is generated from the wider native
DCI-P3. Each TV Color Gamut is individually calibrated at the factory.
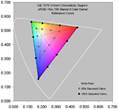
Measurements: The
Absolute Color Accuracy of the OLED TV is Truly
Impressive as shown in these Figures. It has an
Absolute Color Accuracy of 1.6 JNCD for the 2K
Full HD sRGB / Red.709 Color Gamut used for all Full HD TV content, and 1.8 JNCD for the Wider DCI-P3 Color Gamut used for 4K
Ultra HD TVs and Digital Cinema. In addition, the White Points for both Color
Gamuts are also very accurate, within 0.6 JNCD
from the D65 Standard White Point. The LG OLED TV is the most color accurate TV
that we have ever measured. Its Color Accuracy is Visually
Indistinguishable from Perfect, and is very likely considerably better
than any display or TV that you have.
See this Figure for an explanation
and visual definition of Just Noticeable Color Difference JNCD and the Color Accuracy Plots
showing the measured display Color Errors for both Color Gamuts. See the Absolute
Color Accuracy section and the Color Accuracy Plots for
measurements and details.
Absolute Luminance Accuracy
In order to produce an accurate
image, the TV display needs to produce an Accurate Luminance (Brightness) value
for every color throughout its entire Color Space. Many displays produce
Accurate Colors but produce them with inaccurate Luminance values, so the
pixels in the image appear with a systematically incorrect distribution of color
and brightness, which distorts the appearance of the picture. Absolute
Luminance Accuracy is a very important picture quality metric.
Every color in the CIE Color Space for a
given Color Gamut and White Point has a particular Luminance value with respect
to the Luminance for the White Point that must be accurately reproduced. We
measured the Absolute Luminance Accuracy for each of the 41 Reference Colors in
each of the two Standard Color Gamuts and analyzed the results.
Measurements: For the 2K Cinema Normal Rec.709 Color Gamut the Average
Luminance Accuracy is ±3% over the entire Color Gamut for the 41 Reference Colors.
For the 4K Cinema Wide DCI-P3 Color Gamut the Average Luminance Accuracy is
also ±3% over
the entire Color Gamut for the 41 Reference Colors. These are very accurate
results, so the image colors are all reproduced with very accurate brightness.
These Absolute Luminance
Accuracy results for the LG OLED TV are excellent and are Visually Indistinguishable from Perfect. See the Absolute
Luminance Accuracy section for measurements and details.
Intensity Scales and Image
Contrast Accuracy
The Intensity Scale (sometimes called the Gray Scale)
generally gets less much attention from consumers and reviewers, but it is
extremely important because it not only controls the image contrast within all
displayed images, but it also controls how the Red, Green and Blue primary
colors mix to produce all of the on-screen colors. So if the Intensity Scale
doesn't closely follow the Standard that was used in producing the content then
both the picture colors and intensities will be inaccurate.
The Standard Intensity Scale is logarithmic (not linear)
and its steepness is called the display’s Gamma, which must remain
logarithmically constant throughout. The steeper the Intensity Scale the
greater the image contrast and the higher the saturation of displayed color
mixtures.
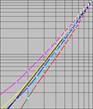
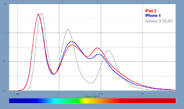
Measurements: The
measured Intensity Scale and Gamma for the LG OLED TV is a very accurate 2.23,
which is very close to the Standard Intensity Scale and Gamma of 2.20, and is Visually Indistinguishable from Perfect. Figure 3 shows the
measured logarithmic Intensity Scale alongside the industry standard Gamma of
2.20. See the Colors
and Intensities section and Figure 3 for measurements
and details.
Picture Brightness and
Contrast
The next series of Lab Tests
and Measurements analyze the overall Picture Brightness, and then the Black
Levels and Contrast Ratio for the TV, which are especially important for
accurately reproducing subtle dark image content and shadow detail.
Picture Brightness
High Picture Brightness for TVs is considered important
by most consumers because TVs are viewed under a wide range of ambient lighting
conditions, and the high image brightness helps to compensate for the reduction
in picture contrast and color saturation when ambient light is reflected off
the screen. Under ideal dark viewing conditions (like in movie theaters and
home theaters) relatively low picture brightness is all that is needed. The
visual brightness (Luminance) is measured in terms of cd/m2, which
is often referred to as nits.
Measurements: The LG OLED
TV delivers fairly bright images for typical TV picture content, which have
Average Picture Levels (APL) of 25 percent or less (compared to an all white
screen). The Cinema modes are designed for viewing in lower ambient lighting,
so they aren’t as bright as the Vivid and Standard modes. The Cinema modes both
have Peak Brightness of 216 nits, while the Vivid mode has a very high Peak
Brightness of 448 nits.
For higher APLs the Brightness of all OLED displays
decreases with increasing APL (average brightness over the screen) of the
picture content. For Higher APLs, which can occur with some web and computer
content that has lots of white backgrounds for text, the OLED brightness
decreases to 145 nits for the Cinema modes and 251 nits for the Vivid mode for
typical mixed content with APLs of 50 percent. For an all Peak White Screen,
which has 100 percent APL, the Peak Brightness falls to 80 nits for the Cinema
modes and 149 nits for the Vivid mode. Such a High APL generally will only
arise if you are viewing a full screen text on an all white background, which
is a PC application.
Most TV picture content has an APL under 25 percent.
Since the screen is fairly large, it will produce a large total amount screen
light with high APL images, so the reduced screen brightness at high APLs might
actually be more comfortable visually for large TV screens. See the Brightness
and Contrast section for measurements and details.
Comparison with LCDs: Some
LCD TVs can produce over 600 nits in SDR picture modes, which is only necessary
in high ambient light. The Brightness (Luminance) for LCD TV displays generally
doesn’t vary with APL. However, with Local Dimming (needed for improving their
Black Levels and Contrast Ratio) the maximum brightness within a Dimming Zone
on the screen is reduced whenever Local Dimming is applied to that Zone. For
very low APLs with Local Dimming the Peak Brightness can decrease
substantially, so that some picture content could become much dimmer or even
nearly invisible. For example, a star field at night with a black background at
night (or in outer space) could appear completely black without the tiny points
of stars being visible, or seen with dim stars and a background that isn’t
quite black. We examine LCD Local Dimming in detail below.
Low Screen Reflectance
The screens on all displays are mirrors that reflect
light from everything that is illuminated anywhere in front of the screen
(especially anything behind the viewers), including lamps, ceiling lights,
windows, direct and indirect indoor and outdoor sunlight, which washes out the
on-screen colors, degrades image contrast, and interferes with seeing the
on-screen images. The lower the Screen Reflectance the better. In fact,
decreasing the Screen Reflectance by 50 percent doubles the effective Contrast
Ratio in Ambient Light, so it is very important.
Measurements: Most TVs,
monitors, smartphones and tablets have a Screen Reflectance of 5 percent or
more. The previous Low Reflectance record that we have ever measured was the
2015 LG OLED TV with just 1.2 percent, a 4:1 advantage in effective Contrast
Ratio in Ambient Light over most displays. The new LG OLED TV is even lower,
with a very impressive 1.1 percent screen Reflectance, the lowest we have ever
measured for any display. See the Screen
Reflections and Brightness
and Contrast sections for measurements and details.
Picture Black Levels and
Contrast Ratio
The Display’s Maximum Contrast
is the Ratio between its Peak White Brightness (Luminance) and its darkest
Black Luminance on the same image, one of the more important measures of
display performance.
Measurements: OLEDs are
light emissive displays that produce perfect image Blacks with 0 cd/m2
Black Levels resulting in an infinite Contrast Ratio. This is visually striking
with darker picture content, and when watching very wide screen movies on the
TV, the letterbox outer borders are invisible for a nice visual effect. See the
Brightness
and Contrast section for measurements and details.
Comparison with LCDs: LCDs
are light transmissive displays that cannot fully block the backlight so they
produce very dark grays instead of perfect Blacks. This results in native
Contrast Ratios (Peak White to actual Black on the same image) in the range of
1,000 to 4,000 for LCDs. For bright picture content the dark gray blacks and
colored content normally aren’t noticeable, but with darker picture content the
dark gray background glow can be quite noticeable and it diminishes both the
picture contrast and color saturation. The Black Levels can be significantly
reduced by selectively dimming the backlight when there is darker picture
content with a technology called Local Dimming, which we examine in detail
below.
SDR and HDR Viewing Tests and
Measurements and Analysis
The next series of tests
summarize the Measurements, Analysis and Viewing Tests for the SDR and HDR
modes.
Full HD Content Viewing Tests
Most existing TV content is for the Full HD resolution, which not
only includes Over The Air (OTA), Cable, and Satellite TV broadcasting, but
also Blu-ray, DVD, digital camera, web content, internet streaming, and
computer content, including photos, videos and movies. So the picture quality
and accuracy of Full HD content is still extremely important.
The Full HD content viewing tests for the LG OLED TV were
simply exceptional, with the picture quality Visually
Indistinguishable from Perfect, with excellent color accuracy and image
contrast accuracy (from a near perfect Intensity Scale) together with perfect
Black Levels. The very challenging set of DisplayMate Test and Calibration
Photos that we use to evaluate picture quality looked absolutely
stunning and Beautiful, even to my experienced hyper-critical eyes.
Even with large changes in viewing position and viewing
angle, the picture quality remained excellent with no visible changes in the
near perfect image contrast and no changes in the perfect Blacks Levels, and
just slight changes in brightness and relatively small changes in color with
angle. So everyone watching the TV sees an excellent picture regardless of
their viewing location, which we analyze in detail below.
Comparison with LCDs: LCDs
deliver excellent picture quality for bright picture content. However, when the
picture includes regions with relatively dark or Black content, then the
visible background glow from the limited Contrast Ratio diminishes both the
picture contrast and the color saturation. The Black Levels can be
significantly improved by selectively dimming the backlight when there is
darker picture content with a technology called Local Dimming, which we examine
in detail below.
HDR High Dynamic Range Modes
The 2016 LG OLED TVs all received an Ultra HD Premium HDR certification from the UHD
Alliance industry consortium, plus they support Dolby Vision in addition to
HDR. Right now there is still only a relatively small amount of HDR and Dolby
Vision content, but it is starting to grow rapidly for both 4K Blu-ray titles
and 4K streaming from Amazon, Netflix, Vudu, and others.
Measurements: The LG OLED
TV significantly exceeds the Ultra HD Premium specified minimum HDR Peak Luminance for OLED TVs of 540 nits in all 3
of its HDR modes – we measured between 630 to 730 nits for the 3 HDR modes in
our Lab tests. We measured the Color Gamut for
HDR content of 101 percent DCI-P3 for the HDR Standard and Bright modes, and
102 percent for the HDR Vivid mode, almost identical to the Wide Cinema SDR
mode. The White Points for the HDR modes are
also almost identical to the SDR Cinema modes, close to 6,500K and within 0.2
to 0.9 JNCD of D65. See the this Figure for the measured
Color Gamuts and White Points and the HDR
Measurements section for measurements and details.
Comparison with LCDs: For LCD TVs, the Ultra HD Premium specified
minimum HDR Peak Luminance is 1,000 nits. As a result, on the LG OLED TV some
of the brightest HDR image detail above 630 to 730 nits will be reproduced, but
not appear as bright as on LCD TVs.
Matching the specified
picture content with the TV’s capabilities is accomplished by varying the HDR Electro-Optical
Transfer Function,
EOTF for the particular content being viewed.
The content producer specifies the EOTF that they want, and then the TV adjusts
that EOTF using Tonal Mapping to match its native performance capabilities,
making a series of compromises to deliver the best overall rendering of the content.
LCD TVs must make EOTF compromises both at the bright-end for Peak Brightness,
and at the dark-end because of their higher Black Levels. OLED TVs are already
perfect at the dark-end so no compromises are needed there, but they have lower
Peak Brightness, so they need to make larger EOTF Tonal Mapping compromises
than LCDs at the bright end.
However, for any
particular picture content, there are many different possible strategies and
compromises for adjusting the EOTF, so the end result will depend on the
particular choices selected by the TV software, and also by the viewer, if the
manufacturer provides user adjustments so they can vary the EOTF and Tone
Mapping according to their own viewing preferences.
High Dynamic Range also requires very low Black Levels.
OLED TVs easily meet the 0.0005 nits Black Level specification, but LCD TVs
need Local Dimming to meet their (higher) 0.05 nits Black Level, which we
examine in detail below.
Ultra HD and HDR Viewing
Tests
Watching and then comparing the same Blu-ray movie titles
with and without HDR content on the LG OLED TV, first viewing the older pre-HDR
disc editions, and then with the same movies released with an Ultra HD Premium
HDR Blu-ray edition provided dramatic and very noticeable visual differences
and enhancements in each movie that we watched – the brighter picture
highlights from the higher Peak Luminance of the HDR picture modes and better
dark content and shadow detail, together with the advanced expanded re-editing
and re-encoding of the content by its producer resulted in more striking and
beautiful picture content. The movies that I watched that visually demonstrated
this best were: X-Men Days of Future Past, The Martian, and Star Trek Into
Darkness.
Comparison with LCDs: While
LCD HDR TVs all exceed 1,000 nits for the brightest HDR picture content, the
perfect Black Levels on the OLED TV provide an Infinite
Contrast Ratio and therefore also an Infinite
Dynamic Range in picture content, but at a lower Peak Brightness. So
while the peak HDR highlights are not as bright on the LG OLED TV, in many
cases the Perfect Black Levels and Infinite Contrast Ratio on the OLED TV give
the impression of having a higher visual Dynamic Range than on LCD HDR TVs.
LCD Local Dimming
Many
high-end LCD TVs include Local Dimming, which can visually lower the high Black
Levels in LCDs. Local Dimming is actually required for LCD HDR TVs in order to
meet the Ultra HD Premium maximum Black Level specification of 0.05 nits, which
is equivalent to a minimum Contrast Ratio of 20,000, and is much higher than
the typical 1,000 to 4,000 native Contrast Ratios of LCD TVs.
With
Local Dimming technology the TV backlight is typically divided into
independently dimmable zones that allow dark areas of an image to have darker less
visually noticeable Black levels, which can be noticeable with darker image
content on LCDs. There are two levels of this technology: Edge Local Dimming, where the zones are
all based along the top and bottom outside edges of the screen, and Full Array Local Dimming, where the zones are
distributed equally spaced throughout the entire area of the screen, typically
with up to 200 zones.
Local
Dimming changes both the dark and bright picture content:
With
Local Dimming, complex algorithms are needed to make a complex set of
compromises between image Brightness and Black levels across the screen, and
all the zones have to be adjusted real-time frame-to-frame with the changing
video content. When a particular zone is darkened it produces lower Black levels
but the zone can no longer produce bright pixel content anywhere within the
zone, so its Peak Brightness is reduced by the same amount that the Black level
is lowered with dimming. A factor of 2 improvement in the Black level means
that the Peak Brightness is reduced by the same factor of 2 everywhere in the
zone – a tradeoff that diminishes some bright picture content in return for a
Darker Black Level. Another crucial issue is that adjacent and nearby zones
must all have similar coordinated dimming levels so that visible differences
between adjacent zones, which can give rise to visually noticeable quilting,
halos, and blooming effects, are not visually apparent. This means that many
areas in an image cannot be sufficiently darkened when the picture content in
nearby zones is brighter. In addition, all of these issues for LCDs apply to both SDR
and HDR content.
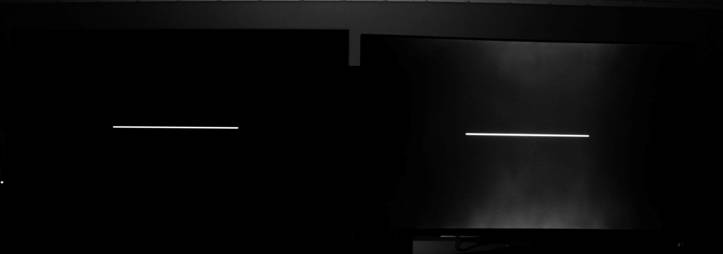
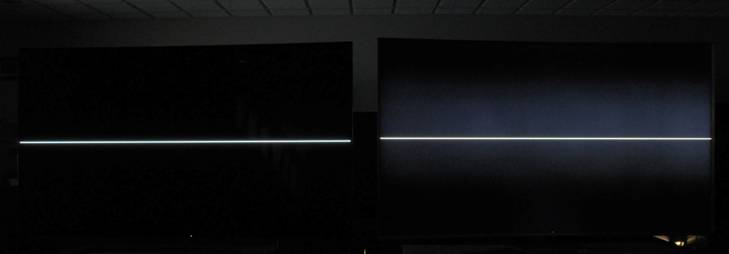
Screen
shots demonstrating Local Dimming:
Below are
photographic screen shots of OLED and LCD TVs taken side-by-side, to
demonstrate these Black level and Local Dimming issues. Both photos were taken of screen
images made with just single pixel width horizontal lines centered on the
screen – the line in the top photo is one third of the screen width for
examining Edge Local Dimming, and the line in the bottom photo (for 2015 TV
models) is the full width of the screen for examining Full Array Local Dimming.
The photos were taken in the dark, with no light
falling on the screens, but with the lab area behind the TVs dimly backlit for
visual reference. A few tiny lights in the lab to the left and below the TVs
are also seen. The LG OLED TVs remain perfectly Black except for the
single pixel width lines. The LCD TVs show large scale areas of the screen with
a visible gray background glow due to the Local Dimming management issues
mentioned above. The Edge Local Dimming zones illuminate vertical columns while
Full Array Local Dimming zones illuminate smaller areas. The photos demonstrate the complex compromises and
limitations of Local Dimming.
Comparison of an LG OLED TV and LCD TVs with Edge Local Dimming and Full
Array Local Dimming
|
|
2016 LG
OLED TV
|
LCD TV
with Edge Local Dimming
|
|
|
|
|
|
2015 LG
OLED TV
|
LCD TV
with Full Array Local Dimming
|
|
|
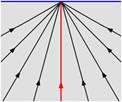
Variations with Viewing Angle
and Position
Large screen TVs are often watched by multiple viewers
from a wide range of viewing positions and angles. We examined how both OLED
and LCD TVs perform at 45 degrees away from the ideal central Sweet Spot with 0
degrees Viewing Angle. All displays and display technologies show some
variation in both color and brightness with Viewing Angle. The smaller the
change with Viewing Angle the better.
Even at a 45 degree Viewing
Angle the LG OLED TV shows relatively small changes in both Color and
Brightness, and no changes in the Black Level, Contrast Ratio, and Intensity
Scale.
• For the LG OLED TV the Brightness (Luminance)
decreases by just 24 percent at 45 degrees
For LCD TVs there is typically a 50 percent or greater
decrease at 45 degrees
• For the LG OLED TV the Black Level remains at
0 nits and the Contrast Ratio remains Infinite at 45 degrees
For LCD TVs there is a large increase in Black Level
and a Large Decrease in Contrast Ratio with Angle
• For the LG OLED TV there is no change in the
Intensity Scale at 45 degrees
For LCD TVs with IPS or FFS technology there is a
small change in Intensity Scale with Viewing Angle
For all other LCD technologies like VA there is a
large change in the Intensity Scale with Viewing Angle
• For the LG OLED TV the Color Gamuts increase
slightly with Viewing Angle
For LCD TVs with IPS or FFS technology there is a
small decrease in Color Gamut with Viewing Angle
For all other LCD technologies like VA there is a
large decrease in Color Gamut with Viewing Angle
Measurements: For the
OLED TV the Color Gamuts both increased slightly by 8-14 percent at 45 degrees
Viewing Angle. Most of the Color Gamut increase arises from the larger shift of
the Blue Primary, which is much less important for visual Color Accuracy than
the Red and Green Primaries, which have much smaller shifts with Viewing Angle.
This results in a moderate 3.8 JNCD shift of White Point at 45 degrees. The
DCI-P3 mode Color Gamut increased from 98% to 112% and sRGB / Rec.709 mode
increased from 108% to 117%. Most LCDs and other display technologies
experience a decrease in Color Gamut and Color Saturation with Viewing Angle,
however a small increase in Color Gamut is desirable for larger Viewing Angles
because the image appears geometrically compressed. See the Viewing
Angles section and Figure 4
for the measurements and details.
Screen Shots: From the
screen shots shown below, the LG OLED TV looks almost identical at a 45 degree
Viewing Angle from the side as it does at 0 degrees Viewing Angle from the
center of the screen.
Comparison with LCDs: For LCD TVs, the variation with Viewing Angle depends
significantly with the particular type of LCD technology being used in the
panel. IPS and FFS LCDs show relatively small changes in color and Intensity
Scale with Viewing Angle, but most manufacturers of large screen TVs use a
different LCD technology called VA (Vertical Alignment) or equivalent
technologies that perform similarly. VA LCDs show particularly large changes
with Viewing Angle, including large decreases in Color Saturation and Contrast.
The photos below are screen
shots of the OLED and LCD TVs at 0 degrees and 45 degrees Viewing Angles for
visually comparing the changes with Viewing Angle. For the 45 degrees side
Viewing Angle, the keystone geometric distortion that is normally seen from
that position has been removed to make the comparison with 0 degrees more straight
forward. Note that the best way to visually evaluate changes with Viewing Angle
on a TV is to look at a fixed image while you shift your viewing position. The
photos below are of a Red Barn Door from the DisplayMate Multimedia with
Test Photos Edition.
The LG OLED TV shows only a
slight color change between the 0 and 45 degrees Viewing Angle positions. On
the other hand, the VA LCD TV shows relatively large changes in hue,
saturation, and image contrast between the 0 and 45 degrees Viewing Angle
positions for the reasons explained above. The camera exposures were adjusted
to equalize the photo brightness levels, so the differences in display
brightness are not shown. Note that all of the white knobs have roughly the
same appearance and brightness. The VA LCD TV shows a more saturated orange
color at 0 degrees as the result of the somewhat different color calibrations
and Intensity Scales. The point being
demonstrated here is the color change with Viewing Angle and not the difference
in the color calibration between the two TVs.
|
2016 LG OLED TV
0 degrees Viewing Angle – Exact Center View
|
|
VA LCD TV
0 degrees Viewing Angle – Exact Center View
|
|

|
|

|
|
2016 LG OLED TV
45 degrees Viewing Angle – View from the Side
|
|
VA LCD TV
45 degrees Viewing Angle – View from the Side
|
|

|
|

|
Response Time and Motion Blur
Motion Blur is a well known issue with LCDs that is seen
with rapidly moving objects in the picture, and also when the camera itself
moves or pans, which shifts the entire screen image all at once. It arises
because the Liquid Crystal, which is the active element within an LCD, is
unable to change its orientation and light transmission rapidly enough when the
picture changes from one frame or refresh cycle to the next. OLEDs, as solid
state emissive devices, have very fast Response Times: LG specifies the OLED
Response Time at 0.1ms, which is more than a factor of 10 faster than LCDs.
For
the Response Time and Motion Blur tests we photographed a DisplayMate Multimedia with
Motion Edition Test Pattern moving at a moderately fast Ultra HD 2,544
pixels per second using a Nikon DSLR camera with a shutter speed of 1/320th of a second, which is
faster than the Refresh Rate and motion compensation rate for the TVs. At 2,544
pixels per second it takes 1.2 seconds for the image to move diagonally across
the entire screen, so the motion is only moderately fast.
The LG OLED TV screen shot below shows a single crisp
image, without any visible latent blur or ghost images left over from earlier
refresh cycles or any shading in the image. This indicates a Response Time that
is significantly faster than 5ms.
For the LCD TV screen shot it is possible to make out a
total of 4 images of the moving diamond-box (the current and 3 earlier images)
on the gray background at the 120 Hz refresh rate, indicating a Response Time
in the neighborhood of 20 ms for this LCD.
Response Time and Motion Blur Screen Shots
Ultra HD 2,544 Pixels
Per Second Motion with a 1/320th second screen photo
Moderately fast screen
motion that takes 1.2 seconds to move diagonally across the screen
|
|
2016 LG OLED TV
|
VA LCD TV
|
|

|

|
Conclusions: An Outstanding OLED TV
Display…
The primary goal of this Display Technology Shoot-Out
article series has always been to publicize and promote display excellence
so that consumers, journalists and even manufacturers are aware of and
appreciate the very best in displays and display technology. We point out which
manufactures and display technologies are leading and advancing the
state-of-the-art for displays by performing comprehensive and objective
scientific Lab tests and measurements together with in-depth analysis. We point
out who is leading, who is behind, who is improving, and sometimes
(unfortunately) who is back pedaling… all based solely on the extensive
objective careful Lab measurements that we also publish, so that everyone can
judge the data for themselves as well… Follow DisplayMate on Twitter to learn about
our future display technology coverage.
Conclusions Overview
In the Conclusions sections below, we first summarize all
of the results, then review several of the most significant display topics, and
then discuss the future of OLED TVs.
See the main Display
Shoot-Out Comparison Table for all the DisplayMate Lab measurements and
test details, together with Figure
1, Figure 2, Figure 3, Figure 4, Figure 5. See the Results
Highlights section above for a more detailed introduction and overview with
expanded discussions and explanations.
An Outstanding OLED TV Display
The third generation 2016 LG
OLED TV performed exceptionally well throughout all of the Lab Tests and
Viewing Tests. It has a Truly Impressive OLED
display, with absolutely stunning and beautiful picture quality across the
board, even at large Viewing Angles. It is unquestionably the Best Performing TV that we have ever tested or
watched… In terms of picture quality the LG OLED TV is Visually
Indistinguishable from Perfect. Even in terms of the exacting and
precise Lab Measurements it is close to ideal, and it breaks many TV Display Performance Records.
OLED TV Picture Quality
The LG OLED TV is far better than the best Plasma TVs in
every display performance category, and even better than the $50,000 Sony
Professional CRT Reference Studio Monitors that up until recently were the
golden standard for picture quality. In fact, based on our detailed lab tests
and measurements the LG OLED TV has the highest Absolute Color Accuracy, the
highest Absolute Luminance Accuracy, and the highest Contrast Ratio with
perfect Black Levels of any TV that we have ever tested, so it even qualifies
as a Reference Studio Monitor.
The 2016 LG OLED TV matches
or breaks new TV Display Performance Records for:
• The Highest Absolute Color Accuracy
(1.6 to 1.8 JNCD) – Visually Indistinguishable from
Perfect
• The Highest Absolute Luminance Accuracy (±3%)
– Visually Indistinguishable from Perfect
• Very Accurate Image Contrast and Intensity
Scale (with Gamma 2.23) – Visually Indistinguishable
from Perfect
• Perfect Black Levels and Highest
(Infinite) Contrast Ratios – Visually
Indistinguishable from Perfect
• Very
Accurate DCI-P3 and sRGB / Rec.709 Color Gamuts for the Cinema and HDR Picture
Modes
• The
Highest Peak Brightness for an OLED TV (221 to 472 nits for SDR) and (630 to
730 nits for HDR)
• The
Lowest Screen Reflectance (1.1 percent)
• The
Highest Contrast Rating in High Ambient light (196 to 407 for SDR)
• The
Smallest Brightness Variation with Viewing Angle up through 45 degrees (24
percent)
• Very
Fast Response Time and no Visible Motion Blur
• Almost
every display lab test and measurement shows some improvements compared to the
2015 LG OLED TV.
See the Results Highlights
section and the Display
Shoot-Out Comparison Table together with Figure 1, Figure 2, Figure 3, Figure 4, Figure 5 for all of the
measurements and details.
3 TVs in One
The LG OLED TV is in effect 3
TVs in One, and it performed very accurately and exceptionally well
in all 3 TV Picture Content Standards: 2K Full HD
TV, and 4K Ultra HD TV, and
the new HDR High Dynamic Range TV,
meeting and exceeding the required specifications for Ultra
HD Premium certification.
HDR High Dynamic Range
Picture Quality
HDR was just introduced this year at the 2016 Consumer
Electronics Show in January. For the new HDR standards and new HDR content, the
2016 LG OLED TVs all received an Ultra HD Premium
certification from the UHD Alliance industry consortium, plus they all support
Dolby Vision in addition to HDR. Right now there is still only a relatively
small amount of HDR and Dolby Vision content, but it is starting to grow
rapidly for both 4K Blu-ray titles and 4K streaming from Amazon, Netflix, Vudu,
and others.
Watching and then comparing the same Blu-ray movie titles
with and without HDR content on the LG OLED TV, first viewing older pre-HDR
disc editions, and then with the same movies released with a Ultra HD Premium
HDR Blu-ray edition, provided dramatic and very noticeable visual differences
and enhancements in each movie that we watched – the brighter picture
highlights from the higher Peak Luminance of the HDR picture modes and better
dark content and shadow detail, together with the advanced expanded re-editing
and re-encoding of the content by its producer resulted in more striking and
beautiful picture content.
OLED HDR versus LCD HDR
The LG OLED TV significantly exceeds the specified
minimum HDR Peak Luminance for OLED TVs of 540 nits in all 3 of its HDR modes,
which measured between 630 to 730 nits in our Lab tests. While LCD HDR TVs all
exceed 1,000 nits, the perfect Black Levels on the OLED TV provide an Infinite Contrast Ratio and therefore also an Infinite Dynamic Range in picture content, but with a
lower Peak Brightness than LCDs. So while the peak HDR highlights are not as
bright on the LG OLED TV, in many cases the Perfect Black Levels and Infinite
Contrast Ratio on the OLED TV give the impression of having a higher visual
Dynamic Range than on LCD HDR TVs.
Watching OLED TVs in Low
Ambient Light
The key to appreciating and seeing the very best
outstanding picture quality that OLED TVs can deliver is by watching TV in as
low as possible ambient lighting, because any light that falls and reflects off
the screen will wash out its stunning picture contrast from the perfect Black
Levels and Infinite Contrast Ratio. In low ambient
light the picture contrast and colors are absolutely stunning, and the picture
quality incredible!
Improving OLED TVs
For this third generation OLED TV, LG has continued to
systematically improve the display performance of their already high
performance OLED TVs. In almost every display lab test and measurement category
the 2016 OLED TV shows significant improvements compared to the 2015 OLED TV
that we tested last year. Those continuing improvements are what lead to top
display performance, which we hope LG will continue with in the next generation
OLED TVs. For 2017, it is a safe bet that we will see further improvements in
the Color Gamut, Color Accuracy, Luminance Accuracy, and Viewing Angle
performance.
The biggest challenge for all OLED displays is continuing
to increase their Peak Brightness (Luminance). The underlying issue is that
every sub-pixel in an OLED display is electrically powered to emit its light.
Higher brightness requires more power, so the display backplane must be able to
carry high current levels for all 33 million sub-pixels that emit light. On the
other hand, LCDs have an entirely separate backlight, so it is much easier for
LCDs to increase their Peak Brightness by using more and brighter White LEDs in
the separate backlight.
Higher Brightness is important in order to improve the
screen visibility and picture quality in higher ambient light viewing
conditions (even though low ambient light always results in the best TV picture
quality). Higher Peak Brightness is also needed for showing the new HDR High
Dynamic Range content, which can specify picture highlights all the way up to
10,000 nits, although no TV is capable of reaching that. Right now all LCD HDR
TVs are required to exceed 1,000 nits, and the current record is about 1,400
nits. OLED HDR TVs are required to exceed 540 nits, and the LG OLED TV goes up
to 730 nits. However, both OLED materials and device structures are continuing
to improve, and smaller OLED displays are now reaching 1,000 nits (for the low
APLs needed for HDR), so we will likely see OLED TVs reaching that level in the
near future.
Affordable OLED TVs
The most important consumer issue will be bringing down
the price of the OLED TVs as quickly as possible. The retail price for this
2016 65 inch LG model E6 4K OLED TV is $5,000 US (September 2016), way above
what most consumers can afford. The smaller 55 inch LG model E6 4K is now
$3,500 US, and the less expensive 55 inch model B6 4K that has the same OLED
panel is now $2,500 US. However, putting this into perspective, early high-end
Plasma TVs cost considerably more than $10,000 (and that’s not counting
inflation), so OLED TVs are already comparatively more affordable.
For 2016 LG Display expects to produce 1 million OLED TV
panels, and their prediction for 2017 is 1.5 million, so OLED prices will
undoubtedly be coming down due to the rapidly increasing production levels.
Finally, if you really want to buy a lower cost OLED TV right now, then
consider the still available 2015 55 inch 2K LG OLED TV for $1,400 US (on
Amazon).
While LCDs still have an overwhelming market share for
all TVs sold, OLED TVs have now captured a significant market share at the
high-end of the U.S. market. According to NPD, a global market research
company, for 65 inch TVs above $3,000, OLED TVs now have almost a 50% market
share, and for 55 inch TVs above $2,000, OLED TVs now have more than a 60%
market share.
The Future of OLED
The TV market has always been incredibly competitive, and
it has always been extremely hard for new display technologies to get a
foothold. Different display technologies have different native strengths and
competitive advantages, so it is essential that we have at least two leading
competing TV technologies to serve different viewing environments and
applications. Over the last 6 years it has been exciting to watch OLED
technology flourish and earn its rightful place as a premier display technology
alongside established LCDs...
DisplayMate Display Optimization Technology
All
displays can be significantly improved using DisplayMate’s proprietary very
advanced scientific analysis and mathematical display modeling and optimization
of the display hardware, factory calibration, and driver parameters. We help
manufacturers with expert display procurement, prototype development, display
performance improvement and optimization, testing displays to meet contract
specifications, and production quality control so that they don’t make mistakes
similar to those that are exposed in our public Display Technology Shoot-Out
series for consumers. This article is a lite version of our advanced scientific
analysis – before the benefits of our DisplayMate Display Optimization
Technology, which can correct or improve all of these issues. If you are a
display or product manufacturer and want to significantly improve display
performance for a competitive advantage then Contact DisplayMate Technologies.
|
2016 LG OLED TV
|
Display Shoot-Out Comparison Table
Below we
examine in-depth the OLED display on the LG OLED 65E6
TV based on objective Lab measurement
data and criteria.
The
measurements are listed under these section headings:
Display
Specifications, Screen
Reflections, Brightness
and Contrast, Colors
and Intensities,
Absolute
Color Accuracy, Absolute
Luminance Accuracy, Viewing
Angles, Display
Light Spectra.
For
additional background information see our 2015 Flagship OLED
and LCD TV Display Technology Shoot-Out.
For
comparisons with the other TVs and Multimedia displays see our Display Technology Shoot-Out
series.
Display Specifications
|
Categories
|
LG OLED
TV
Model 65E6
|
Comments
|
|
Display Technology
|
OLED TV Display Panel
Pixels have 4 RGBW
Sub-Pixels for Red, Green, Blue and White
|
Organic Light Emitting Diode
|
|
Display Size
|
64.5
inches
Flat
Screen Model Tested
|
Size is the Diagonal screen length.
Available with both Flat and Curved
Screens.
|
|
Supported Color Gamuts
|
4K mode
– DCI-P3 Standard Color Gamut
2K
mode – sRGB / Rec.709 Standard Color Gamut
|
The LG OLED TV supports 2 Color Gamut
Standards.
|
|
Screen Shape
|
16:9 =
1.78
Aspect
Ratio
|
The 16:9 Aspect Ratio
is a perfect match for Widescreen TV
video.
|
|
Screen Area
|
1778
Square Inches
|
A better measure of size than the
diagonal length.
|
|
Display Resolution
|
3840 x
2160 pixels
4K Ultra
HD
|
Screen Pixel Resolution.
Double the Resolution of a Full HD 1920
x 1080 TV.
|
|
Total Number of Pixels
|
8.3 Mega
Pixels
|
Total Number of Pixels.
|
|
Pixels Per Inch
|
68 Pixels
Per Inch
|
Sharpness depends on the viewing distance
and PPI.
See
this on sharpness and visual acuity for displays
|
|
20/20 Vision Distance
where Pixels or Sub-Pixels
are Not Resolved
|
Appears Sharp from 50 inches or more
Appears
Sharp from 4.2 feet or more
Appears Sharp from 1.3 meters or more
|
For 20/20 Vision the minimum viewing
distance
where the screen appears perfectly sharp
to the eye
|
|
TV Appears Perfectly Sharp
at Typical Viewing Distances
|
Yes
|
Typical Viewing Distances for this
screen size are
8 feet (2.4 meters) or more.
|
|
Screen Reflections
All display screens are mirrors – but that is
actually a very bad feature…
We measured the light reflected from all directions
and also direct mirror (specular) reflections, which are much more
distracting and cause more eye strain.
Our Lab Measurements include Average Reflectance
for Ambient Light from All Directions and for Mirror Reflections.
The 2016 LG OLED TV has the lowest
screen Reflectance levels that we have ever measured for any display.
Note that the Screen Reflectance is
exactly the same for all of the Picture Modes.
|
Categories
|
LG OLED
TV
|
Comments
|
|
Average Screen Reflection
Light From All Directions
|
1.1 percent
for
Ambient Light Reflections
Excellent
|
Measured using an Integrating Hemisphere
and
a Spectroradiometer.
|
|
Mirror Reflections
Percentage of Light Reflected
|
1.9 percent
for Mirror Reflections
Excellent
|
These are the most annoying types of
Reflections.
Measured using a Spectroradiometer and a
narrow
collimated pencil beam of light
reflected off the screen.
|
|
Brightness and Contrast
The TV Brightness and Contrast varies with the
Picture Modes and the Average Picture Level APL of the Picture Content.
All Measurements are for 0 degrees
Viewing Angle.
|
Categories
|
Vivid
mode
Native Wide
Gamut
|
4K
Cinema mode
DCI-P3
Gamut
|
2K
Cinema mode
sRGB/Rec.709
Gamut
|
Comments
|
|
Brightness for Standard Picture Modes
|
|
Very Low Level Picture Content
Measured Peak Brightness
For 1% Average Picture Level
|
Brightness
472 cd/m2
For Low
APL
|
Brightness
221 cd/m2
For Low APL
|
Brightness
221 cd/m2
For Low APL
|
This is the Peak Brightness for a screen
that
has only a very low 1% Average Picture
Level.
|
|
Typical TV Picture Content
Measured Peak Brightness
For 25% Average Picture Level
|
Brightness
448 cd/m2
For Typical
TV APL
|
Brightness
216 cd/m2
For Typical
TV APL
|
Brightness
216 cd/m2
For Typical
TV APL
|
This is the Peak Brightness for typical
TV content
that has a 25% Average Picture Level.
|
|
Smart TV and PC Content
Measured Brightness
For 50% Average Picture Level
|
Brightness
251 cd/m2
For Medium
APL
|
Brightness
145 cd/m2
For Medium
APL
|
Brightness
145 cd/m2
For Medium
APL
|
This is the Peak Brightness for typical
Smart TV
and PC content that has a 50% Average
Picture Level.
|
|
All White Screen
Measured Peak Brightness
For 100% APL Full Screen White
|
Brightness
149 cd/m2
For High APL
|
Brightness
80 cd/m2
For High APL
|
Brightness
80 cd/m2
For High APL
|
This is the Brightness for an entirely
all white screen
with 100% Average Picture Level.
|
|
HDR High Dynamic Range Modes
|
|
HDR High Dynamic Range
Measured Peak Brightness
For 10% Area White Window
|
|
HDR
Standard Peak Brightness 630 cd/m2
HDR
Bright Peak Brightness 690 cd/m2
HDR
Vivid Peak Brightness 730 cd/m2
|
|
These are the Peak Brightness for the
HDR Picture modes measured using
a 10% Area Window for Peak White.
For OLED TVs the standard is 540 cd/m2
or more.
|
|
HDR High Dynamic Range
Measured Color Gamut
Measured in the dark at 0 lux
See Figure 1
|
|
HDR
Standard Color Gamut 101% of DCI-P3
HDR
Bright Color Gamut 101% of DCI-P3
HDR
Vivid Color Gamut 102% of DCI-P3
|
|
These are the measured Color Gamuts for
the HDR Picture modes.
See Figure 1
for the plotted Color Gamuts.
See Figure 2 for the
definition of JNCD.
|
|
HDR High Dynamic Range
Measured Color of White
Color Temperature in degrees
See Figure 1
|
|
HDR
Standard White Point 6,487K 0.9 JNCD from D65
HDR
Bright White Point 6,525K 0.2 JNCD from D65
HDR Vivid
White Point 11,656K 9.9 JNCD from D65
|
|
This is the measured White Points for
the HDR Picture modes.
See Figure 1
for the plotted White Points.
See Figure 2 for the
definition of JNCD.
|
|
Contrast for Low Ambient Light
|
|
Black Brightness at 0 lux
|
0 cd/m2
Outstanding
|
0 cd/m2
Outstanding
|
0 cd/m2
Outstanding
|
The Black Luminance is true zero for the
OLED.
|
|
True Contrast Ratio at 0 lux
Relevant for Low Ambient Light
|
Infinite
Outstanding
|
Infinite
Outstanding
|
Infinite
Outstanding
|
This is the native true Contrast Ratio
for the display.
|
|
Contrast for High Ambient Light
|
|
Typical TV Picture Content
Contrast Rating
for High Ambient Light
For 25% Average Picture Level
|
Contrast
Rating 407
for High
Ambient Light
Excellent
for TVs
|
Contrast
Rating 196
for High
Ambient Light
Very Good
for TVs
|
Contrast
Rating 196
for High
Ambient Light
Very Good
for TVs
|
Measures how easy it is to see the screen
picture
content under high ambient lighting.
The higher the Contrast Rating the
better.
Depends on the Screen Reflectance and
Brightness.
Defined as Maximum Brightness / Average Reflectance.
See High
Ambient Light Screen Shots
|
|
Colors and Intensities
The Color Gamut, Intensity Scale, and White Point
determine the quality and accuracy of all displayed images and all
the image colors. A Color Gamut that is larger than
the Standard Gamut is definitely Not Better because the display
needs to match all of the standards that were used
when the content was produced.
All Measurements are for 0 degrees
Viewing Angle.
|
Categories
|
Vivid
mode
Native Wide
Gamut
|
4K
Cinema mode
DCI-P3
Gamut
|
2K
Cinema mode
sRGB/Rec.709
Gamut
|
Comments
|
|
Color of White
Color Temperature in degrees
Measured in the dark at 0 lux
See Figure 1
|
11,580 K
9.4 JNCD
from D65 White
Intentionally
Bluish
See Figure 1
|
6,581 K
0.6 JNCD
from D65 White
Very Close
to Standard
See Figure 1
|
6,597 K
0.6 JNCD
from D65 White
Very Close
to Standard
See Figure 1
|
D65 with 6,500 K is the standard color
of White
for most consumer and TV content and
needed
for accurate color reproduction of all
images.
JNCD is a Just Noticeable Color Difference.
White Point accuracy is more critical than
other colors.
See Figure 1
for the plotted White Points.
See Figure 2 for the
definition of JNCD.
|
|
Color Gamut
Measured in the dark at 0 lux
See Figure 1
|
Vivid mode
129
percent
sRGB /
Rec.709 Gamut
103
percent
DCI-P3
Gamut
Intentionally
Vivid
Native Wide
Gamut mode
See Figure 1
|
4K Cinema
mode
98 percent
DCI-P3
Gamut
Very Close
to Standard
Accurate 4K
Cinema mode
See Figure 1
|
2K Cinema
mode
108
percent
sRGB /
Rec.709 Gamut
Fairly
Close to Standard
Accurate 2K
Cinema mode
See Figure 1
|
The 2K sRGB / Rec.709 is the color
standard
for over 95 percent of all current TV
content
and is needed for accurate color
reproduction.
The new 4K DCI Color Gamut is 26 percent
larger
than the sRGB / Rec.709 Color Gamut.
See Figure 1
|
|
Absolute Color Accuracy
|
|
Absolute Color Accuracy
Average Color Error
All Colors within the Gamut
For the 41 Reference Colors
Just Noticeable Color Difference
See Figure 2
|
Vivid mode
Intentionally
Vivid Colors
Intentionally
Not Accurate
Not
Analyzed
|
4K Cinema
mode
Average
Color Error
From
DCI-P3
Δ(u’v’)
= 0.0111
1.8 JNCD
Excellent
Accuracy
Accurate 4K
Cinema mode
See Figure 2
|
2K Cinema mode
Average
Color Error
From sRGB
/ Rec.709
Δ(u’v’)
= 0.0064
1.6 JNCD
Excellent
Accuracy
Accurate 2K
Cinema mode
See Figure 2
|
JNCD is a Just Noticeable Color Difference.
See Figure 2 for the
definition of JNCD and for
Accuracy Plots showing
the measured Color Errors.
Average Errors below 3.5 JNCD are Very
Good.
Average Errors 3.5 to 7.0 JNCD are
Good.
Average Errors above 7.0 JNCD are
Poor.
|
|
Absolute Color Accuracy
Largest Color Error
All Colors within the Gamut
For the 41 Reference Colors
Just Noticeable Color Difference
See Figure 2
|
Vivid mode
Intentionally
Vivid Colors
Intentionally
Not Accurate
Not
Analyzed
|
4K Cinema
mode
Largest Color Error
From
DCI-P3
Δ(u’v’)
= 0.0202
5.1 JNCD
for Blue
Very Good
Accuracy
Accurate 4K
Cinema mode
See Figure 2
|
2K Cinema
mode
Largest Color Error
From sRGB
/ Rec.709
Δ(u’v’)
= 0.0140
3.5 JNCD
for Blue-Magenta
Very Good
Accuracy
Accurate 2K
Cinema mode
See Figure 2
|
JNCD is a Just Noticeable Color Difference.
See Figure 2 for the
definition of JNCD and for
Accuracy Plots showing
the measured Color Errors.
Largest Errors below 7.0 JNCD are
Very Good.
Largest Errors 7.0 to 14.0 JNCD are
Good.
Largest Errors above 14.0 JNCD are
Poor.
This is twice the limit for the Average
Error.
|
|
Absolute Luminance Accuracy
|
|
Absolute Luminance Accuracy
Average Luminance Error
All Colors within the Gamut
For the 41 Reference Colors
See Figure 2
|
Vivid mode
Intentionally
Vivid Colors
Intentionally
Not Accurate
Not
Analyzed
|
4K Cinema
mode
Average
Luminance Error
Over the
Entire Gamut
3 percent
Excellent
Accuracy
Accurate 4K
Cinema mode
|
2K Cinema
mode
Average
Luminance Error
Over the
Entire Gamut
3 percent
Excellent
Accuracy
Accurate 2K
Cinema mode
|
The Luminance Error is the difference
between the
actual and standard Brightness
(Luminance) for any
specific color within the entire Color
Gamut.
Average Errors below 5 percent are
Very Good
Average Errors 5 to 10 percent are
Good
Average Errors above 10 percent are
Poor
See Figure 2 for the 41
Reference Colors.
|
|
Absolute Luminance Accuracy
Largest Luminance Error
All Colors within the Gamut
For the 41 Reference Colors
See Figure 2
|
Vivid mode
Intentionally
Vivid Colors
Intentionally
Not Accurate
Not
Analyzed
|
4K Cinema
mode
Largest Luminance Error
Over the
Entire Gamut
9 percent
for Blue
Very Good
Accuracy
Accurate 4K
Cinema mode
|
2K Cinema
mode
Largest Luminance Error
Over the
Entire Gamut
7 percent
for Red
Very Good
Accuracy
Accurate 2K
Cinema mode
|
The Luminance Error is the difference
between the
actual and standard Brightness
(Luminance) for any
specific color within the entire Color
Gamut.
Largest Errors below 10 percent are
Very Good
Largest Errors 10 to 20 percent are
Good
Largest Errors above 20 percent are
Poor
This is twice the limit for the Average
Error.
See Figure 2 for the 41
Reference Colors.
|
|
Intensity Scale and Image Contrast Accuracy
|
|
Intensity Scale
Determines Image Contrast
See Figure 3
|
Vivid mode
Intentionally
Irregular
Intentionally
Not Accurate
Not
Analyzed
|
Intensity
Scale
Very
Smooth
Logarithmically
Straight
Excellent
See Figure 3
|
Intensity
Scale
Very
Smooth
Logarithmically
Straight
Excellent
See Figure 3
|
The Intensity Scale controls image
contrast needed
for accurate Image Contrast and Color
reproduction.
See Figure 3
|
|
Gamma for the Intensity Scale
Gamma Standard is 2.20
Higher has more Image Contrast
See Figure 3
|
Vivid mode
Intentionally
Irregular
Intentionally
Not Accurate
Not
Analyzed
|
Gamma 2.23
Excellent
Close to
Perfect
|
Gamma
2.23
Excellent
Close to
Perfect
|
Gamma is the log slope of the Intensity
Scale.
Gamma of 2.20 is the standard and needed
for
accurate Image Contrast and Color
reproduction.
See Figure 3
|
|
Image Contrast Accuracy
|
Intentionally
Irregular
|
Excellent
|
Excellent
|
See Figure 3
|
Categories
|
Vivid
mode
Native Wide
Gamut
|
4K
Cinema mode
DCI-P3
Gamut
|
2K
Cinema mode
sRGB/Rec.709
Gamut
|
Comments
|
|
Viewing Angles
The variation of
Brightness, Contrast, and Color with Viewing Angle is especially important
because
large screen TVs are
often watched by multiple viewers from a wide range of viewing positions and
angles.
Figure 4 shows the measured changes in
Intensity Scale and Color Gamut between 0 and 45 degrees Viewing Angle.
The
variations with Viewing Angle are essentially identical for all of the screen
modes.
|
Categories
|
Vivid
mode
Native Wide
Gamut
|
4K
Cinema mode
DCI-P3
Gamut
|
2K
Cinema mode
sRGB/Rec.709
Gamut
|
Comments
|
|
Brightness Decrease
at a 45 degree Viewing Angle
|
24 percent
Brightness Decrease at 45 degrees
Small
Brightness Decrease
Very Good
|
Most displays have lower brightness
(Luminance)
when viewed at an angle away from the
central sweet spot of 0 degrees.
|
|
Contrast Ratio at 0 lux
at a 45 degree Viewing Angle
|
Infinite
Contrast Ratio at 45 degrees
Outstanding
|
For OLEDs the Black Level does not
change with
Viewing Angle so the Contrast Ratio
remains infinite.
|
|
White Point Color Shift
at a 45 degree Viewing Angle
See Figure
4
|
Fairly
Small Color Shift at 45 degrees
Δ(u’v’)
= 0.0152
3.8 JNCD
Close to
Very Good
A Blue Shift
just Slightly Above our 3.5 JNCD limit for Very Good
See Figure
4
|
JNCD is a Just Noticeable Color Difference.
See Figure 2 for the
definition of JNCD.
See Figure
4
|
|
Change in Intensity Scale
at a 45 degree Viewing Angle
See Figure
4
|
Intensity
Scales remain unchanged at 45 degrees
See Figure
4
|
For OLEDs the Intensity Scale does not
change
with Viewing Angle.
See Figure
4
|
|
Change in Color Gamut
at a 45 degree Viewing Angle
See Figure
4
|
sRGB /
Rec.709 Gamut increases to 117% at 45 degrees
DCI-P3 Gamut increases to 112% at 45 degrees
Most of the
Color Gamut increase is from the Blue Primary
A small
increase in Color Gamut is desirable for larger Viewing Angles
See Figure
4
|
The OLED TV Color Gamuts increase
somewhat
with Viewing Angle due to the optical
path through
the sub-pixel filters within the
display.
See Figure
4
|
|
Display Light Spectra
OLEDs are
emissive displays that use specially formulated Organic LED materials to
produce the Red, Green, and Blue Primary Colors.
Figure 5 shows the Light
Spectra for the Red, Green, and Blue Primaries on the LG OLED TV.
Rather than laying out three separate
sets of OLED Red, Green, and Blue sub-pixels throughout the screen, the LG
OLED TV instead has a single uniform set of OLED White sub-pixels throughout
made as a combined stack of Red, Green, and Blue OLED colors for each
sub-pixel. The sub-pixels then each have their own individual Red, Green and
Blue color filters that select the specific Red, Green or Blue OLED color for
that sub-pixel. This approach greatly simplifies the OLED production,
improves yields, and lowers the manufacturing costs. In addition, LG has also
added a 4th clear sub-pixel to every pixel that just produces pure White.
This increases the display’s power efficiency and also improves color
accuracy and color management.
|
About the Author
Dr. Raymond Soneira is
President of DisplayMate Technologies Corporation of Amherst, New Hampshire,
which produces display calibration, evaluation, and diagnostic products for
consumers, technicians, and manufacturers. See www.displaymate.com. He is a research
scientist with a career that spans physics, computer science, and television
system design. Dr. Soneira obtained his Ph.D. in Theoretical Physics from
Princeton University, spent 5 years as a Long-Term Member of the world famous
Institute for Advanced Study in Princeton, another 5 years as a Principal
Investigator in the Computer Systems Research Laboratory at AT&T Bell
Laboratories, and has also designed, tested, and installed color television
broadcast equipment for the CBS Television Network Engineering and Development
Department. He has authored over 35 research articles in scientific journals in
physics and computer science, including Scientific American. If you have any
comments or questions about the article, you can contact him at dtso.info@displaymate.com.
DisplayMate Display Optimization Technology
All
displays can be significantly improved using DisplayMate’s proprietary very
advanced scientific analysis and mathematical display modeling and optimization
of the display hardware, factory calibration, and driver parameters. We help
manufacturers with expert display procurement, prototype development, display
performance improvement and optimization, testing displays to meet contract
specifications, and production quality control so that they don’t make mistakes
similar to those that are exposed in our public Display Technology Shoot-Out
series for consumers. This article is a lite version of our advanced scientific
analysis – before the benefits of our DisplayMate Display Optimization
Technology, which can correct or improve all of these issues. If you are a
display or product manufacturer and want to significantly improve display
performance for a competitive advantage then Contact DisplayMate Technologies.
About DisplayMate Technologies
DisplayMate Technologies specializes in proprietary advanced
scientific display calibration and mathematical display optimization to deliver
unsurpassed objective performance, picture quality and accuracy for all types
of displays including video and computer monitors, projectors, TVs, mobile
displays such as Smartphones and Tablets, and all display technologies
including LCD, OLED, 3D, LED, LCoS, Plasma, DLP and CRT. This article is a lite version of
our intensive scientific analysis of Smartphone and Smartphone mobile displays
– before the benefits of our advanced mathematical DisplayMate Display Optimization
Technology, which can correct or improve many of the display deficiencies. We offer DisplayMate display
calibration software for consumers and advanced DisplayMate display diagnostic
and calibration software for technicians and test labs.
For
manufacturers we offer Consulting Services that include advanced Lab testing
and evaluations, confidential Shoot-Outs with competing products, calibration
and optimization for displays, cameras and their User Interface, plus on-site
and factory visits. We help manufacturers with expert display procurement,
prototype development, and production quality control so they don’t make
mistakes similar to those that are exposed in our Display Technology Shoot-Out
series. See our world renown Display
Technology Shoot-Out public article series for an introduction and preview.
DisplayMate’s
advanced scientific optimizations can make lower cost panels look as good or
better than more expensive higher performance displays. If you are a display or
product manufacturer and want to turn your display into a spectacular one to
surpass your competition then Contact
DisplayMate Technologies to learn more.
Article Links: 2015
Flagship OLED and LCD TV Display Technology Shoot-Out
Article Links: Absolute
Color Accuracy Display Technology Shoot-Out
Article Links: Display
Color Gamuts Shoot-Out NTSC to Rec.2020
Article Links: Display Technology Shoot-Out
Article Series Overview and Home Page
Copyright © 1990-2016 by DisplayMate
Technologies Corporation. All Rights Reserved.
This article, or any part
thereof, may not be copied, reproduced, mirrored, distributed or incorporated
into any other work without
the prior written permission of DisplayMate Technologies Corporation