LCD Response Time and Motion Blur
Dr. Raymond M. Soneira
President, DisplayMate Technologies Corporation
Copyright © 1990-2009 by DisplayMate
Technologies Corporation. All Rights Reserved.
This article, or any part
thereof, may not be copied, reproduced, mirrored, distributed or incorporated
into any other work without
the prior written permission of DisplayMate Technologies Corporation
Introduction
Every
display technology has its own set of unique strengths and weaknesses and
limitations. While each technology steadily improves over time, memories of
their initial weaknesses and limitations often persist for a long time
afterwards, and can turn into demons that plague the technology forever. The
best example of this effect are Plasmas, with their so-called “burn-in” (which
is actually uneven aging), a problem that was technically overcome many years
ago but which lingers like an 800 pound gorilla that still threatens to kill
this excellent display technology. Plasma manufacturers bear much of the blame
because they have chosen to avoid this issue in their marketing (like an
ostrich hoping that the problem will simply go away) rather than confronting
this widely held perception.
LCDs have
their own 800 pound gorilla: limited Response Time, which causes motion blur.
Just like Plasmas, this was a significant problem for LCDs many years ago, and
we’ll demonstrate that it too is no longer an issue now. But unlike Plasmas,
the LCD manufacturers have turned this into a brilliant marketing strategy, offering
ever more sophisticated and enhanced motion processing and ever higher 120 Hz
and 240 Hz screen refresh rates to repeatedly over-sell a solution to a
problem… that is no longer a problem.
Consumers
(especially the technically savvy) have become enthralled with the Response
Time specifications and the various proprietary motion enhancement technologies
offered by each manufacturer, which all spiral in a vicious cycle of
one-upmanship. Unfortunately, none of this stands up to objective scientific
testing. As we’ll demonstrate below, while the motion blur performance with
moving test patterns was much worse than what’s claimed in the manufacturer’s
specifications, the motion blur performance during the extensive viewing tests
with a wide range of live video content viewed simultaneously on a large number
of HDTVs surprised us by turning out much better than expected. Motion blur
proved to be a non-issue for live video in all of the mid to high-end LCDs in
our tests. We’ll explore these points one-by-one…
FIGURE 1
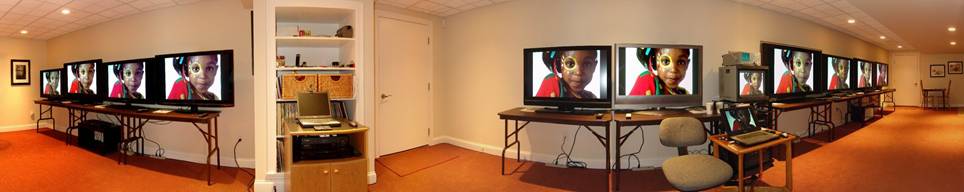
Figure 1. The Shoot-Out with the
lights turned on.
Photograph by Dieter Michel, Publisher of PROSOUND and Medientechnik
& Systemintegration Magazines, Germany.
LCD Response Time and Motion Blur
Motion blur
is a well known issue with LCDs. It arises because the liquid crystal, which is
the active element within an LCD, is unable to change its orientation and
transmission rapidly enough when the picture changes from one frame to the
next. Since the standard video rate is 60 frames per second, a pixel is
expected to be able to fully update its light transmission opacity within 16.7
milli-seconds (a 60th of a second). If it takes any longer than that
then the image will show some degree of lag, which appears as a trailing smear
or blur whenever there is motion. It also affects the visibility of the leading
portions of moving objects.
LCD motion
blur is generally evaluated with an industry standard specification called
Response Time. Unfortunately, it’s not a particularly good indicator for real
picture blur because it measures the time that it takes for a pixel to go from
black to peak intensity white and then back to black again. However, most
picture transitions involve much smaller and more subtle shades of gray-to-gray
transitions, which can take considerably longer to complete. On the other hand,
blurring is much harder to detect visually when there are subtle gray-to-gray
transitions because the initial and final states are so similar. But it’s even
more complicated than that because every pixel is actually made up of
independent red, green and blue sub-pixels that have their own separate
intensities, frame-to-frame transitions and times. So visual blur within a
picture that has some motion is a fairly complex and nebulous phenomenon.
The Response
Time and motion blur depend on many factors, including the viscosity and
thickness of the liquid crystal layer. Many different methods of electronic
processing are used to try to speed up the pixel-to-pixel transitions. One
common method is to temporarily exaggerate the drive voltage used during a
transition, which is called overdriving. It’s sort of like giving the liquid
crystal an extra hard kick in the pants to get it moving quickly. The problem
is that it’s very hard to give just the right amount of kick for all possible
transitions, and that leads to overshoot, inverse ghosting, and image flicker.
Another method is edge enhancement using high frequency peaking. And then there
is the one that all of the manufacturers are bragging about – updating the screen
more frequently by increasing the refresh rate from 60 Hz up to 120 Hz or more.
We’ll show photographic evidence for all of these below. Most either introduce
objectionable artifacts into the images or are just ineffective marketing
gimmicks.
Because the
published specifications can have a considerable impact on sales, it is often
more important for a manufacturer to reduce the black to peak white to black
Response Time value rather than improving the visually more important
gray-to-gray transitions or reducing the motion artifacts that result from
electronically pushing the Response Time. As a result, the LCD display with the
fastest Response Time specification may not have the smallest visual blur. This
was the case in our tests.
The Shoot-Out
Figure 1
shows 11 HDTVs in the DisplayMate Technologies Demo Lab. Included are eight
LCDs, two Plasmas, and one CRT Sony Professional HD Trinitron Studio Monitor,
which was used as the reference standard. This was an in-depth scientific study
that included precise calibrations, comprehensive spectroradiometer
measurements, and a large number of jury panelists that viewed test patterns,
test photos, and lots of high quality High Definition video material. The
Shoot-Out was a large operation that was jointly produced by DisplayMate
Technologies (www.displaymate.com) in
collaboration with Insight Media (www.insightmedia.info),
however, all of the technical analysis was done by the author. Part I of this
article covered LCD and Plasma picture quality, color and gray-scale accuracy,
color gamuts, contrast ratios, and viewing angles.
The HDTVs included models from the top-tier brands of
(alphabetically) LG, Samsung, Sharp and Sony - from the mid-line to
top-of-the-line models. All of the units were from the 2008 model year.
Differences between the 2008 and 2009 models are primarily in their marketing
hype. For this article we had three flagship top-of-the line LCD models from
Samsung (LN-T5281F), Sharp (LC-52D92U) and Sony (KDL-52XBR4). By studying the
top-of-the-line models from the market leaders we were assured of examining the
state-of-the-art for each display technology and each manufacturer. The
consumer mid-line models included LG (42LG50), Samsung (LN40A550P3F), and Sony
(KDL-40V3000). The remaining two LCD units were consumer HDTVs but not
commercially available models.
The top-of-the-line Sony XBR and Sharp units had 120 Hz
screen refresh, the top-of-the-line Samsung had strobed LED backlighting, and
all of the other units had standard 60 Hz screen refresh. The goal was to
determine the degree to which this varied advanced technology affected visible
motion blur.
Moving Test Patterns
The first
step in evaluating motion blur is to use specialized moving test patterns in
order to cleanly examine and analyze the blur and related artifacts. After
studying these results we’ll graduate to moving photographs and finally to live
video. To generate the moving test patterns and photographs we used DisplayMate Multimedia with
Motion Bitmaps Edition, which includes 25 proprietary motion test patterns
and 35 test photos that can be moved in different directions and speeds on
screen. This digital video was fed simultaneously to all of the HDTVs, which
were compared side-by-side in a Shoot-Out configuration as shown in Figure 1.
We used a Nikon D90 DSLR camera to photograph the moving
test patterns and photographs. The screen shots were taken with a shutter speed
of 1/160th second, which is less than the refresh cycle time. These screen
shots objectively measure the LCD display's own hardware blur, artifacts, and response
time, and are consistent with what a human observer actually sees with these
moving images.
The
differences in motion blur between the 8 LCD HDTVs was not large. There were
only minor differences between all of units. The reason is that the visible
blur was considerably longer than the 60 Hz video frame rate, so it didn’t
matter whether the screen refresh was 60 Hz or 120 Hz, or whether the LED
backlights were strobed off during the frame updating. Similarly, varying the
electronic processing enhancements that some models offer, which are supposed
to reduce motion blur, only served to introduce objectionable contours, edges
and other artifacts onto moving objects without reducing the overall motion
blur. In addition, there was no notable difference in motion blur between the
top-of-the-line models (which all had 120 Hz refresh or LED strobing) and the
mid-line models (which all had standard 60 Hz refresh), and which cost less
than half of the high-end models.
To
illustrate the motion blur results we took screen shots of the Sony XBR, which
was the best performing LCD in Part I of the
Shoot-Out in terms of picture quality and accuracy. It also had a trifle
less motion blur and artifacts than the other units, but again the differences
were not large. The manufacturer’s published Response Time for this model is 8
ms. Since this corresponds to a double transition - from black to peak white
and then back to black again - the single transition time (from black to white
or from white to black) should therefore be about 4 ms.
For the
DisplayMate test patterns shown below a live view by eye clearly detected
blurring out to considerably more than 60 ms. The screen shots are not quite as
sensitive as the live view by eye. But in all of the screen shots it is
possible to make out at least 8 individual refresh cycles, each offset from the
other by 1/120th second (which comes to about 65 ms). Since the blur trails
decay smoothly over time, any definition of Response Time, whether visual or
instrumented, is ad hoc because you have to pick a specific cutoff
intensity value. The screen shots are marked with the indicated times. Compare
them to the manufacturer’s single transition Response Time specification of 4
ms. In order to show the blur in the screen shot photos as clearly as possible
we used motion speeds around 1000 pixels per second. At this speed it takes two
seconds to cross the 1920x1080 screen width. Objects frequently move much
faster than that in real video.
Figures 2a
to 2f are screen shots of several DisplayMate test patterns moving at different
speeds and directions. In all of the screen shots it is possible to make out
the individual 120 Hz refresh cycles. The white tips seen on edges and fine
detail in all of the moving test patterns are artifacts resulting from the
electronic processing enhancements used to reduce the Response Time. The dark
outer edges seen on the screen shots are due to the response time lag in
transitioning from a surrounding black background (not shown) to the gray
background. The dark trails appear somewhat more pronounced than the bright
trails because, while the LCD’s response is linear, the eye's visual response
is based on (nonlinear) brightness ratios, which accentuate the differences in
darker content.
FIGURE 2
|
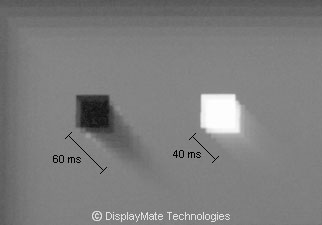
Figure 2a. Measured H and V Speed
1093 pixels per second.
|
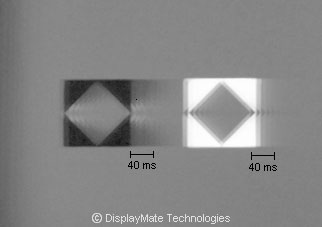
Figure 2b. Measured H Speed 1083
pixels per second.
|
|
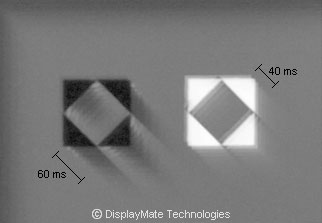
Figure 2c. Measured H and V Speed
820 pixels per second.
|
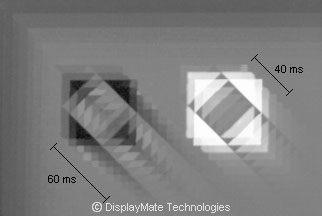
Figure 2d. Measured H and V Speed
1609 pixels per second.
|
|
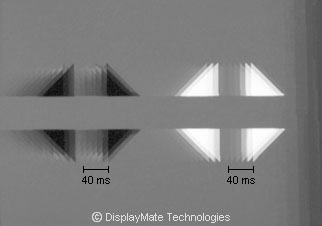
Figure 2e. Measured H Speed 1190
pixels per second.
|
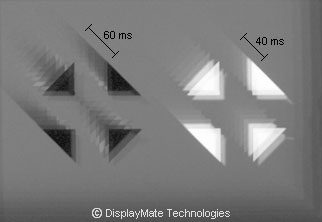
Figure 2f. Measured H and V Speed
991 pixels per second.
|
Note that
in the screen shot with the highest motion speed, 1609 pixels per second in
Figure 2d, the most recent frames (upper left and right) are clearly still
developing and have not reached their final density (rise response time). Most
of the other screen shots also show this same effect, although it is not as
obvious.
The test
patterns in Figure 2 are only a small selection of the complete set of
DisplayMate motion test patterns that we examined, which include many different
combinations of gray-to-gray and color-to-color transitions.
Moving Photographs
Test
patterns are also perfectly valid images, no different in principle from any
other image or picture content that is displayed. Absolutely every effect,
artifact and defect that you see in any test pattern also appears in every
image and picture. The difference is that test patterns are often constructed
to maximize the visibility of specific effects, artifacts and defects. That is
the definitely the case with the DisplayMate motion test patterns used in the
previous section, which were carefully designed and optimized to show the
motion blur and artifacts.
Photographic images, on the other hand, typically consist
of a very complex and varied admixture of blended picture elements. With so
much going on in an image, motion blur is easily obscured and lost within the
complex variegated imagery of a typical photograph. In particular, the
photographs lack the uniform backgrounds used in the test patterns, which make
it easier to see the motion blur trails. Still, from what we learned with the
test patterns we expect to be able to see the effects of motion blur most
easily when there are sharp bright to dark or black to dim transitions or
strong to weak color saturation transitions.
Figures 3b and 4b are screen shots of two moving
photographs and Figures 3a and 4a are identical screen shots without any motion.
Notice how much less noticeable the blurring appears because of the complexity
of the image content and the uneven backgrounds. It’s important to note that we
picked the two photos out of the 35 within DisplayMate Multimedia with Motion
that showed the strongest visual motion blur. Most of the other photographs had
less visually noticeable blur.
FIGURE 3


Figure 3. NASA Photograph of
Astronaut Barbara Morgan.
A: Left Photo: No motion. B: Right
Photo: Measured motion is 1009 pixels per second right to left.
FIGURE 4

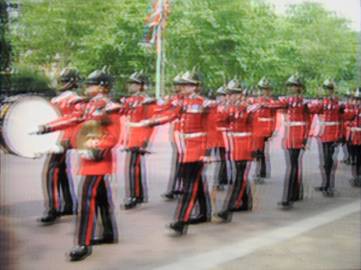
Figure
4. Guard Parade Photograph by Lauren Soneira.
A: Left
Photo: No motion. B: Right Photo: Measured motion is 1018 pixels per second
right to left.
In Figure 3
there are 4 strong refresh cycle images that are visible (33 ms) and a total of
8 refresh cycles can be seen in portions of the picture (67 ms). In Figure 4
there are 3 strong refresh cycle images that are visible (25 ms) and a total of
6 refresh cycles can be seen in portions of the picture (50 ms). Their visibility
depends on the nature of the intensity and color transitions and the textures
of adjacent content that overlap as the image moves.
The speed of these images is 1000 pixels per second,
which corresponds to a screen crossing time of 2 seconds. At slower speeds the
length of the blur is proportionally smaller. So for these photographs the blur
is unlikely to be noticeable for speeds under 500 pixels per second, which
corresponds to screen crossing time of 4 seconds, a relatively slow speed. On
the other hand, most of the other photographs had less noticeable blur, so
visible blur is very image content dependent.
Moving
photographs are none-the-less moving static images, which are quite different
from live video, where the images are part of a complex and varied mixture of
continually blending picture components that are themselves constantly changing
in both time and position. The closest thing to moving photographs are the news
and stock tickers on some television stations, and the vertical title rolls at the
end of most movies. Television stations fine-tune their tickers to minimize the
appearance of motion blur and artifacts in consumer TVs, a high percentage of
which are now LCDs.
Live Video
While moving test patterns and photographs are very
interesting and enlightening for studying motion blur and artifacts, live video
is what consumers actually watch on their HDTVs. With even more screen activity
going on we expect to visually detect much less motion blur in live video than
with either the moving static photographs or test patterns. The first issue to
consider is that there is no such thing as typical live video because of the
incredible variety and diversity of content. Fortunately, we know from the
moving test patterns and photographs what kinds of picture content are most
likely to produce visible motion blur. And of course there needs to be lots of
on-screen motion.
Most of the
live video sources that we chose were sports based because they have lots of
motion and most have brightly colored uniforms and background content. We
recorded them on an all-digital High Definition Tivo from full bandwidth
over-the-air ATSC broadcast television. It directly records the original
broadcast mpeg data stream without any processing or degradation. Note that
satellite and cable video sources have reduced signal bandwidth that introduces
additional motion artifacts because of the extra compression needed whenever
there is motion in the picture. We also didn’t use any film based content,
because it’s shot at 24 frames per second and requires considerably more
interpolation and motion processing than video cameras with 60 fields per
second.
Included
were hours of recorded football, basketball, hockey, skiing, and golf. Most of
these are daytime or brightly lit events. For darker content we used nighttime
NASCAR racing, indoor gymnastics and ice skating, the television show Dancing
with the Stars, and Over America, which is a Blu-ray HD video that
is shot entirely from a fast moving helicopter. It has 90 minutes of continuous
full screen motion, with both daytime and nighttime scenery. It includes lots
of very challenging high speed motion content. With these choices of videos we
were using very aggressive content for detecting motion blur.
Live Video Motion Shoot-Out
One
important issue for live video, as opposed to the previous precision computer
generated moving photographs and test patterns, is that they are all shot from
video cameras under varying conditions and may have unknown degrees of video
processing. That can result in source video that is blurred with varied
artifacts. We certainly didn’t want to blame an LCD for a blurred or defective
picture when the cause was in the source. In order to carefully monitor the
quality of the source video we used a Sony Trinitron Professional HD Broadcast
Studio Monitor, which is a CRT and did not have any visible motion blur or
artifacts (except for barely visible tiny phosphor trails seen only in fast
moving test patterns). So, whenever there was questionable content we carefully
evaluated it on the CRT monitor.
The
Shoot-Out was fully operational for several months, so we had lots of time to
study and compare all of the effects, and over that period of time we had
several dozen people come by to see it running and evaluate the effects
themselves, including industry experts, manufacturers, engineers, reviewers,
journalists, and ISF instructors, all of which are trained observers.
All of the
HDTVs were fed identical simultaneous digital video from the content list above
using the digital Tivo or Blu-ray player. They were all compared side-by-side
in a Shoot-Out configuration as shown in Figure 1. If any viewer thought they
detected motion blur on any HDTV we would repeatedly press the 8-second Tivo
backup button and watch the sequence over and over again on all of the units
(including the CRT monitor) until we fully understood exactly what was
happening on each HDTV. We did the same thing with the Blu-ray player and its
content.
The
conclusions from everyone that participated in the Shoot-Out were consistent
across the board and will likely surprise most consumers: there was essentially
no visually detectable motion blur on any of the LCD HDTVs in all of the
extensive live video content that we assembled. When people thought they saw
motion blur, with only a handful of minor exceptions, the blur was either in
the source video or a temporary visual illusion that disappeared when the
segments in question were reviewed. Unlike the moving test patterns and moving
photographs, the eye is unable to detect the blur in live video because the
images are much more dynamic and complex, and undoubtedly because of the way
the brain processes and extracts essential information from visual images. The
results were identical for all of the LCD HDTVs, regardless of whether they had
60 or 120 Hz refresh rates, strobed LED backlighting, or advanced motion
enhancement processing.
Summary and Recommendations
Response
Time specifications are not a scientifically accurate or meaningful indicator
of picture blur, which is what we have found with most of the HDTV
specifications in our Display
Technology Shoot-Out article series. In fact, in our tests the LCD with the
shortest Response Time had the greatest motion blur. You’ll see published
values down to as little as 2 ms, but the motion blur we measured with moving
test patterns on the top-of-the-line HDTVs was over 40 ms, which is more than a
factor of 10 greater than the manufacturer’s specifications.
We also
found that the proprietary motion enhancement processing technologies provided
in most HDTVs actually just introduce ugly motion artifacts into the image
rather than reducing the overall visual motion blur. The best picture quality
was obtained with the motion enhancement processing minimized or turned off.
After
extensive side-by-side objective testing with moving test patterns, moving
photographs and live video we found that there was no visually detectable
difference in motion blur performance for current mid to top-of-the-line LCD
HDTVs, regardless of their Response Time, 60 or 120 Hz refresh rates, strobed
LED backlighting, or motion enhancement processing. While there was
considerable motion blur in the moving test patterns, motion blur was simply
not visually detectable in real live video content during our extensive
side-by-side testing. With only a handful of minor exceptions, whenever blur
was seen in live video we always found it to be in the source content or a
temporary visual illusion that disappeared when the segments in question were
reviewed. This is undoubtedly due to the way the brain processes and extracts
essential information from dynamic and complex moving images.
These
results and conclusions will surprise many technically savvy consumers and
videophiles because there has been so much talk about Response Time and motion
blur. Like Plasma “burn-in” some of this is just old information and memories.
A lot of the current “knowledge base” on this topic are simply the echoes from
all of the marketing brouhaha. It’s also very easy to think that you see blur
when you’re looking at lots of fast action on a single TV, and a lot of it
undoubtedly has its origins in the human visual system. It just doesn’t stand
up to the extensive scientific side-by-side testing that we’ve described here.
Our most
important and significant result is that the LCD manufacturers have finally
beaten the motion blur problem. So it's time for both consumers and
manufacturers to forget about this tamed 800 pound Response Time gorilla and
focus on much more productive and fascinating display technology and marketing
issues, such as the upcoming generations of 3D displays.
As a result
our bottom line recommendations are… If you stick with the mid to top tier
models from the reputable brands, you should ignore Response Time
specifications, not worry about LCD motion blur, and don’t spend extra for 120
Hz or higher refresh rates, strobed LED backlighting, or advanced motion blur
processing.
About the Author
Dr. Raymond Soneira
is President of DisplayMate Technologies Corporation of Amherst,
New Hampshire, which produces video calibration, evaluation, and diagnostic
products for consumers, technicians, and manufacturers. See www.displaymate.com. He is a research
scientist with a career that spans physics, computer science, and television
system design. Dr. Soneira obtained his Ph.D. in Theoretical Physics from
Princeton University, spent 5 years as a Long-Term Member of the world famous
Institute for Advanced Study in Princeton, another 5 years as a Principal
Investigator in the Computer Systems Research Laboratory at AT&T Bell
Laboratories, and has also designed, tested, and installed color television
broadcast equipment for the CBS Television Network Engineering and Development
Department. He has authored over 35 research articles in scientific journals in
physics and computer science, including Scientific American. If you have any
comments or questions about the article, you can contact him at dtso.info@displaymate.com.
Article Links: LCD-Plasma Display
Technology Shoot-Out
Display
Technology Shoot-Out Article Series Overview and Home Page
Copyright © 1990-2009 by DisplayMate
Technologies Corporation. All Rights Reserved.
This article, or any part
thereof, may not be copied, reproduced, mirrored, distributed or incorporated
into any other work without
the prior written permission of DisplayMate Technologies Corporation