Display Color Accuracy Shoot-Out
Six Flagship Smartphones and
Tablets
Dr. Raymond M. Soneira
President, DisplayMate Technologies
Corporation
Copyright © 1990-2014 by DisplayMate
Technologies Corporation. All Rights Reserved.
This article, or any part
thereof, may not be copied, reproduced, mirrored, distributed or incorporated
into any other work without
the prior written permission of DisplayMate Technologies Corporation
Introduction
If you walk into a Walmart, Best Buy, or any major TV retailer, all of
the TVs are showing identical videos, but their colors will be noticeably (to
obnoxiously) different on every TV on the wall – even in Best Buy’s high-end
Magnolia showrooms. Why is that? One reason is that the TV picture controls
have been played with – but this would still be true even with factory fresh
TVs right out of the box. It’s also true with Smartphones and Tablets that as a
rule don’t provide any color controls, which is probably better because visual
tweaking generally makes matters worse. And that is exactly the root cause of
the problem that originates right at the factory – the displays are not
individually fully adjusted and calibrated with instruments, and instead
depend on visually tweaking at some point during manufacturing.
Some manufacturers and models provide better color accuracy than others.
We have taken the six best mobile displays from our Display Technology Shoot-Out
article series over the last year and compared their color accuracies all
together side-by-side with detailed and very revealing measurement results.
Since we only test the best performing displays to begin with, they were already
known to have fairly good color accuracy, so we’ll learn which are the Best of
the Best, and the reasons why…
But why is color accuracy important? Poor to mediocre color accuracy has
been the rule since the dawn of color TVs in the 1950s, and people are also
accustomed to seeing mediocre color prints from their film and now digital
cameras. But the technology is already available that makes it possible for
today’s consumer displays to be as color accurate as the best studio production
monitors that cost $50,000 ten years ago. And once you get used to beautiful
accurate colors on a display you won’t want to go back…
One reason why color accuracy is now especially important is that most
internet content is loaded with images and photos, and it’s nice (and sometimes
important) to know that you are actually seeing what the images and photos
really look like. A more practical (and sometimes critical) reason is when you
are buying online merchandise – you want to be sure that the colors you see on
the display are accurate, so you’ll have a good idea of exactly what you are
buying and are less likely to return it. And for many, an essential reason (and
the clincher) is that you want to see accurate colors for your own digital
photos, and those from family and friends, which is especially important
because you often know exactly what everything and everyone should actually
look like.
Currently the cameras on Smartphones and Tablets (as well as consumer
compact cameras and Pro Digital SLR cameras) are better calibrated than the
displays you view their photos on because displays are more difficult to
accurately calibrate. And finally, there are many specialized and professional
applications that require or would benefit from much better color accuracy,
such as in sales and marketing presentations, and especially medical imaging,
where it can improve diagnostics.
In this article we measure and analyze the Absolute Color Accuracy of
each display in four different ways and then Rank them in each category:
Entire Color Gamut:
First, for each display we’ll measure and analyze the entire Color Gamut
covering the complete range of colors that the display produces to see how the
color accuracy varies throughout the entire Gamut.
Facial Skin Tone Colors:
While the eye is sensitive to a very wide range of colors, some colors are more
important than others. In particular, it is especially important to accurately
render facial skin tone colors (for people of all races and ethnic groups
worldwide). So second, we will measure and analyze the accuracy of Facial Skin
Tone Colors independently.
Organic Colors: Most
organic colors that occur in nature are heavily weighted in the red to green
parts of the spectrum, which also encompasses browns, oranges, and yellows.
This includes most foods, fruits, vegetables, and plants – so it is especially
important to get those correct because we all carry accurate visual memories of
what they actually should look like in the real world. For example, we
generally evaluate the quality of most foods by their color. Many displays
don’t even do a very good job with ordinary green leaves and grass. So third,
we’ll measure and analyze the accuracy of Organic Colors independently. This
same region of vibrant red to green colors is also frequently used to get your
attention in advertising and signs, to clothing, to familiar products and
everyday objects – another reason to get these colors right in a display.
Blue Region from Cyan to Magenta Colors: On the other hand, the accuracy of Blues covering the entire
range from Cyan to Magenta are generally less critical for visual color
accuracy. While the eye can still detect color differences and color errors in
them, for the most part we are less likely to notice or be troubled by color
differences and discrepancies with colors in the Blue Region. So fourth, we’ll
measure and analyze Blues from Cyan to Magenta independently as well.
While Color Accuracy has been steadily improving, it still has a long
way to go because the color differences between these flagship displays are
still easy to see. We’ll explain the causes and the solution. We’ll cover these
issues and much more, with in-depth comprehensive display tests, measurements
and analysis that you will find nowhere else.
The Display Color Accuracy Shoot-Out
We have taken the six best mobile displays from our Display Technology Shoot-Out
article series over the last year and compared their color accuracies all
together side-by-side. Since we only test the best performing displays to begin
with, they were already known to have fairly good color accuracy. The displays
in this Color Accuracy Shoot-Out include (alphabetically):
Amazon Kindle Fire HDX
8.9 2013 model – we haven’t yet tested the recently released 2014 model.
Apple iPad Air 2
Apple iPhone 6 Plus
– the iPhone 6 has very similar Color Accuracy performance to the iPhone 6
Plus.
Microsoft Surface
Pro 3
Samsung Galaxy Note
4 set for the Basic Screen Mode.
Samsung Galaxy Tab
S 10.5 set for the Basic Screen Mode.
Note that the Basic
Screen Mode for the Samsung models, which we test here, is just one of four
available Screen Modes that is selected under Display Settings (which many
consumers and reviewers seem to be unaware of).
To examine the
performance of these six displays we ran our
in-depth series of Mobile
Display Technology Shoot-Out Lab tests and measurements. We take display
quality very seriously and provide in-depth objective analysis based on
detailed laboratory tests and measurements and extensive viewing tests with
both test patterns, test images and test photos. To see how far mobile displays
have progressed in just four years see our 2010 Smartphone
Display Shoot-Out, and for a real history lesson see our original 2006 Smartphone
Display Shoot-Out.
Display Color Accuracy Results
In this Results section we provide background information
and Highlights of the Lab tests and measurements. You can also skip these
Results and go directly to the Color
Accuracy Conclusions.
If you’ve ever wondered
why colors are off on a display – there are many contributing factors and causes
including the Color Gamut, the calibrated White Point, the Intensity Scale, and
sometimes “advanced” dynamic picture processing that instead introduces color
errors. It should come as no surprise that in order to produce accurate color
everything needs to be done just right. It’s possible to accurately measure and
map the absolute color accuracy and color errors for any display by using a
spectroradiometer and DisplayMate proprietary test patterns, which we do
throughout our Display Technology Shoot-Out article series.
The Color Gamut
Virtually all current consumer content is based on the Standard
sRGB/Rec.709 Color Gamut, which generates colors using a specified set of Red,
Green, and Blue primary colors. A given display can only reproduce the colors
that lie inside of the color triangle formed by its primary colors. Extremely
saturated colors seldom occur in nature so the colors that are outside of the
Standard Gamut are seldom needed and are unlikely to be noticed or missed in
the overwhelming majority of real images. Note that consumer content does not
include colors outside of the Standard Gamut, so a display with a wider Color
Gamut cannot show colors that aren't in the original and will only produce
inaccurate exaggerated on-screen colors. The Standard sRGB/Rec.709 Color Gamut
is shown in Figure 1, with explicitly calculated colors that accurately show
the real colors within the Gamut – the colors shown in most published Color
Gamuts are wildly incorrect.
Just Noticeable Color Difference JNCD
The on-screen absolute color accuracy for any display can be measured
using a spectroradiometer together with our proprietary set of DisplayMate Test
Patterns. The accuracy of the colors can then be calculated using the 1976 CIE
Uniform Chromaticity color space and compared to the eye's sensitivity to
differences in color. Note that the older 1931 CIE Diagrams that are published
by many manufacturers and reviewers are highly non-uniform and are meaningless
for Color Accuracy. Many reviewers also incorrectly evaluate color accuracy by
using a metric called dE, which is useful for display calibration, but is
meaningless for Color Accuracy because it includes Brightness (Luminance) in
addition to color (Chromaticity). See this regarding Bogus Color Accuracy
Measurements.
We present the color accuracy and color errors here in terms of MPCD Minimum Perceptible
Color Difference or JNCD Just Noticeable Color Difference, where 1 MPCD = 1 JNCD =
Δ(u'v') = 0.0040 on the CIE 1976 Uniform Chromaticity Scale in Figure 1. Color differences less than 1 JNCD are visually
indistinguishable, while values greater than 1 JNCD are visually noticeable
when the two colors are touching on-screen. When the colors are not touching
and are further apart, the visual threshold for Just Noticing a Color
Difference is higher.
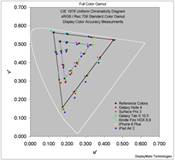
Full Color Gamut Accuracy
In order to deliver very good color accuracy, a display must have a
Color Gamut that is very close to the Standard sRGB/Rec.709 Color Gamut. All of
the flagship displays tested here come very close. Older and lower performance
LCD displays typically have Color Gamuts in the range of 55-65 percent of the
Standard, which results in very large Color Errors greater than 20 JNCD.
In order to evaluate the Color Accuracy throughout the entire Color
Gamut we defined 21 Reference Colors, which are shown in Figure 1. We measure the accuracy of these Reference Colors for
each display, which tells us how accurately the Full Color Gamut is reproduced.
The numerical results are listed in Table 1 below and the individual data points for each display are
shown in Figure 3a. The color spread in the
measured Reference Colors between all of the displays is quite large around 10
JNCD.
The Samsung Galaxy Note 4 [set for the Basic Screen Mode] has the best
Full Gamut Color Accuracy with just 1.5 JNCD average error. The other displays
are listed by increasing error, with the iPad Air 2 the largest, with 3.9 JNCD.
Next we examine the Color Accuracy for different color regions.
Table 1. Measured Absolute
Color Accuracy in the CIE 1976 Uniform Color Space
Average Color Errors in delta
(u’,v’) and Just Noticeable Color Difference JNCD – Smaller is Better
|
|
Full Gamut
Color Accuracy
|
Skin Tone
Color Accuracy
|
Organic
Color Accuracy
|
Blue Region
Color Accuracy
|
White Point
Color Accuracy
|
|
Samsung Galaxy Note 4
Basic
Screen Mode
|
0.0060
1.5 JNCD
|
0.0026
0.7 JNCD
|
0.0026
0.7 JNCD
|
0.0089
2.2 JNCD
|
0.0007
0.2 JNCD
|
|
Microsoft Surface Pro 3
|
0.0084
2.1 JNCD
|
0.0115
2.9 JNCD
|
0.0098
2.5 JNCD
|
0.0073
1.8 JNCD
|
0.0069
1.7 JNCD
|
|
Samsung Galaxy Tab S 10.5
Basic
Screen Mode
|
0.0085
2.1 JNCD
|
0.0122
3.1 JNCD
|
0.0096
2.4 JNCD
|
0.0081
2.0 JNCD
|
0.0044
1.1 JNCD
|
|
Amazon Kindle Fire HDX 8.9 [2013]
|
0.0107
2.7 JNCD
|
0.0168
4.2 JNCD
|
0.0122
3.1 JNCD
|
0.0093
2.3 JNCD
|
0.0104
2.6 JNCD
|
|
Apple iPhone 6 Plus
|
0.0123
3.1 JNCD
|
0.0113
2.8 JNCD
|
0.0100
2.5 JNCD
|
0.0150
3.8 JNCD
|
0.0087
2.2 JNCD
|
|
Apple iPad Air 2
|
0.0155
3.9 JNCD
|
0.0069
1.7 JNCD
|
0.0057
1.4 JNCD
|
0.0216
5.4 JNCD
|
0.0096
2.4 JNCD
|
Facial Skin Tone Color Accuracy
Accurately reproducing the subtle differences in skin tone and
complexion in people’s faces may be the single most color critical application
for a display. In fact, some manufacturers actually tweak the display
calibration for some countries to make sure that face colors come out just
right for the local population. That’s understandable, but a much better
approach is to accurately calibrate the display so that the faces for people of
all colors automatically come out just right without resulting to tweaking,
which always introduces other color errors.
We measured the skin color for a wide selection of people of all races
and ethnic groups in our photo library using a spectroradiometer and a very
accurately calibrated display. The results are shown in Figure 2. What is especially interesting and significant is how
they all fall along a well defined narrow line of color for people of all races
and ethic groups, from the lightest Caucasians to the darkest Africans (which
is perhaps not surprising given that we all just have varying degrees of
melanin and blood capillaries). Note that we are measuring the actual
underlying skin color (chromaticity) not the skin brightness. From this
spectroradiometer data we defined three Reference Colors that accurately
describe the range of skin colors, which we then use to evaluate Skin Tone
Color Accuracy. We measure the accuracy of these Reference Colors for each
display, which tells us how accurately the entire range of Skin Tones are
reproduced. The numerical results are listed in Table 1 above and the individual data points for each display are
shown in Figure 3b. The color spread in the
measured Reference Colors between all of the displays is again quite large
around 10 JNCD.
What is particularly interesting and significant is that the Apple iPad
Air 2 performs considerably better in Skin Tone Color Accuracy than Full Color
Gamut Accuracy, while three of the other displays perform considerably worse in
this critical region. The Galaxy Note 4 and iPhone 6 Plus also perform better
with Skin Tone Color Accuracy. We’ll examine this further in the Conclusions section.
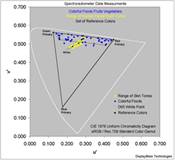
Organic Color Accuracy
Most organic colors that occur in nature are heavily weighted in the red
to green parts of the spectrum, which also encompasses browns, oranges, and
yellows. This includes most foods, fruits, vegetables, and plants (except
flowers). There are only a relatively small percentage of exceptions, such as
blueberries, egg plants, radishes, some plums, and purple cabbage, for example
– just about everything else falls in the red, brown, orange, yellow, and green
categories, which is a well defined and relatively small region of the human
visual color space as shown in Figure 1. In addition, humans have a much lower sensitivity to blue
light. Most fruits have vibrant and saturated colors in order to help attract
the attention of animals that eat and then scatter their seeds. We even
evaluate the quality of most foods by their color. Not surprisingly, these same
food colors that are essential for our survival have also been incorporated and
used to highlight and get our visual attention: such as in advertising and
signs, to clothing, to familiar products and everyday objects – another reason
to get these colors right in a display. Flowers, on the other hand, need to
attract the attention of insects for pollination, whose vision is weighted
towards the blue and ultraviolet portions of the spectrum, which accounts for
the more varied range of colors in flowers that includes many saturated blues,
purples, and violets.
In a similar fashion to Skin Tones, we measured the colors for a wide
selection of colorful foods, fruits, vegetables, and plants (but not flowers)
in our photo library using a spectroradiometer and a very accurately calibrated
display. The results are shown in Figure 2. The most saturated reds include tomatoes, strawberries,
apples, and red peppers. The most saturated greens include (chlorophyll) leafs
of all types, green peppers, and limes. In between are oranges, carrots,
lemons, and bananas. This range also includes cooked and uncooked meats. From
this spectroradiometer data we defined a set of Reference Colors that
accurately describe the range of these organic colors, which we then use to
evaluate Organic Color Accuracy. We measure the accuracy of these Reference
Colors for each display, which tells us how accurately the entire range of
Organic Colors are reproduced. As discussed above, these same saturated food
colors are also common in everyday (inorganic) objects. The numerical results
are listed in Table 1 above and the individual data points for each display are
shown in Figure 3c. The color spread in the
measured Reference Colors between all of the displays is again quite large
around 10 JNCD.
The Apple iPad Air 2 again performs considerably better in Organic Color
Accuracy than the Full Color Gamut Accuracy, while three of the other displays
perform slightly worse in this especially important color region. The iPhone 6
Plus performs slightly better and the Galaxy Note 4 maintains its excellent
color accuracy. We’ll examine this further in the Conclusions
section.
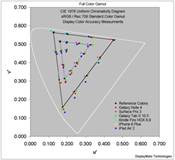
Blue Region from Cyan to Magenta Color Accuracy
The more important Skin Tone and Organic Colors all fall in the Red to
Green parts of the spectrum and CIE Color Space. On the other hand, the Blue
region covering the entire range from Cyan to Magenta shown in Figure 1 covers about half of the entire sRGB/Rec.709 Color Space,
so it is still very important visually. However, as we have discussed above,
while the eye can still detect color differences and color errors in the Blue
region as small as 1 JNCD, for the most part we are less likely to notice or be
troubled by much larger color differences and discrepancies with colors in this
range compared with Skin Tone and Organic Colors. The numerical results are
listed in Table 1 above and the individual data points for each display are
shown in Figure 3a. The color spread in the
measured Reference Colors between all of the displays is again quite large
around 10 JNCD.
The Apple iPhone 6 Plus (with 3.8 JNCD) and iPad Air 2 (with 5.4 JNCD)
have the largest errors in the Blue Region. All of the other displays have
significantly better accuracy, about 2.0 JNCD in the Blue Region.
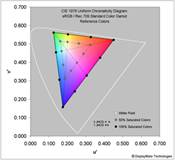
The White Point
All display colors except the three full saturation Red, Green, and Blue
primary colors explicitly depend on the defined color of White, which is called
the White Point, so it is especially important for the display to have a very
accurate White Point. The White Point clearly affects all of the lower
saturation colors because they are relatively close to white. However, even
full saturation colors like Cyan, Yellow, and particularly Magenta change
considerably with even a minor shift in the White Point because they are the
complementary colors to the Red, Green and Blue primaries, so they “reflect”
through the actual White Point set for the display. Since Magenta is the
furthest away from the White Point it changes the most, but all colors (from
low to high saturation) are affected by the exact location of the White Point.
All of the relevant Standard Color Gamuts (sRGB, Rec.709, Adobe RGB, for
example) use the Standard D65 White Point, which is essentially the color of
outdoor natural daylight at noon, with a Color Temperature of about 6,500 K.
D65 is needed to produce accurate colors for digital photos, videos, TV, and
internet content. However, many displays are set to a bluer White Point with a
higher Color Temperature from 7,000-8,500 K. Many consumers are simply used to
that white, and many actually prefer a bluish white for the background on text
screens. Unfortunately, that shifts all of the display colors and adds a bluish
cast to all images, which may be quite noticeable with some Facial Skin Tones
(people will look more pale) and with many Organic Colors. One reason why the
Kindle, iPhone, and iPad have lower Full Gamut Color Accuracy is due in part to
their bluer less accurate White Points, which are listed in Table 1 and plotted in Figures 3a-c.
Viewing Tests
With
large color variations of up to 10 JNCD between the displays shown in Figures 3a-c, it was fairly easy to
see some significant visual differences between all of the displays on many
test photos and test images. None-the-less all six of these flagship displays
for the most part have fairly good color accuracy for most casual viewing applications. But
for careful or intensive viewing of most images and photos, and for special
applications like sales presentations and medical imaging, for example, they
may not be good enough.
Click to Enlarge
Display Color Accuracy Conclusions:
The primary goal of this Display Technology Shoot-Out
article series has always been to point out which manufactures and display
technologies are leading and advancing the state-of-the-art of displays by
performing comprehensive and objective Lab tests and measurements together with
in-depth analysis. We point out who is leading, who is behind, who is
improving, and sometimes (unfortunately) who is back pedaling… all based solely
on the extensive objective measurements that we also publish, so that everyone
can judge the data for themselves as well… See the main Display
Color Accuracy Comparison Table for all of the measurements, and the Results
Highlights and Introduction
sections for background information and details.
Best of the Best
We have taken the six best mobile displays from our Display Technology Shoot-Out
article series over the last year and performed an in-depth analysis of
their Color Accuracy. Since we only test the best performing displays to begin
with, they were already known to be fairly good. There are none-the-less
significant differences between them. With color
variations of up to 10 JNCD between the displays shown in Figure 3, it was fairly easy to see
some significant visual differences between all of the displays. So, while we learned which
ones are the Best
of the Best, there is still plenty of room for
future improvement, which we discuss below.
The Rankings
We used the Color
Accuracy Measurements from Table 1
above to generate an ordered 1 to 6 Ranking of the displays in each Color
Accuracy category to help identify the Best of the
Best, which is shown in the Table
below. When the color accuracy values are fairly close we labeled them as a Tie
with abcd according to their actual pecking order. Here are the results…
1. The Samsung Galaxy
Note 4 is the winner in Absolute Color Accuracy, coming in first place in all categories for its Basic
Screen Mode setting.
2. The Microsoft
Surface Pro 3 and the Samsung Galaxy Tab
S 10.5 are tied closely for
overall second place.
One particularly interesting and significant result is
that the Apple iPhone 6 Plus and iPad Air 2 perform considerably better in both
the very important Skin Tone and Organic Color Accuracy categories, with the
iPad Air 2 coming in a solid second behind the first place Galaxy Note 4. Its seems likely that Apple has concentrated on the important
Red to Green part of the Color Space, which includes both the Skin Tone and
Organic Colors. On the other hand, both the iPhone 6 Plus and iPad Air 2
are in last place for the Full Gamut Color Accuracy. This is partly the result
of an over saturated Blue primary that distorts almost the entire Blue Region,
which accounts for about half of the half of the entire Color Space and
increases the Average Color Error, and also partly due to the less accurate
bluish White Point. The iPhone 6 has very similar Color Accuracy performance to
the iPhone 6 Plus as shown here.
The Amazon Kindle Fire HDX
8.9 winds up being squeezed between these two major Color Accuracy
trends and comes in between 4th and 6th place. When we originally tested it in
November 2013 it captured first place in Color Accuracy. It is still very good,
but has slipped because overall Color Accuracy has been steadily improving over
the last year. We hope to test the new 2014 model in the near future.
Absolute Color Accuracy
Rankings from the Lab Measurements in Table 1
Labeled Best to Worst with 1-2
in Bold Blue, 1-3 in Green, and 4-6 in Yellow, with Close Ties Labeled abcd
|
|
Full Gamut
Color Accuracy
|
Skin Tone
Color Accuracy
|
Organic
Color Accuracy
|
Blue Region
Color Accuracy
|
White Point
Color Accuracy
|
|
Samsung Galaxy Note 4 Basic Mode
|
1
|
1
|
1
|
1c
|
1
|
|
Microsoft Surface Pro 3
|
2a
|
3b
|
3b
|
1a
|
3
|
|
Samsung Galaxy Tab S 10.5 Basic Mode
|
2b
|
3c
|
3a
|
1b
|
2
|
|
Amazon Kindle Fire HDX 8.9 [2013]
|
4
|
6
|
6
|
1d
|
4c
|
|
Apple iPhone 6 Plus
|
5
|
3a
|
3c
|
5
|
4a
|
|
Apple iPad Air 2
|
6
|
2
|
2
|
6
|
4b
|
The Next Step – Perfect Color
Accuracy with Color Management and Factory Instrument Calibration
Display Color Accuracy will continue to rapidly improve,
particularly for mobile displays, now that all of the leading products are
providing a fairly good match to the sRGB/Rec.709 Standard Color Gamut.
Up until now this has been accomplished almost
exclusively by adjusting the materials and chemistry of the backlight LEDs,
OLEDs, and LCD color filters, which is a very difficult and involved process.
The Next Step is to use Color Management implemented in software and firmware
to tweak the color mixtures to produce a perfect match for the Red, Green, and
Blue Primary Colors and the White Point. When that happens (together with an
accurate power-law Intensity Scale) the Display Color Accuracy will become
visually indistinguishable from perfect.
In fact, this is how Samsung has risen to first place in
Color Accuracy – because their OLED displays have a very wide native Color Gamut
they had to implement Color Management in order to be able produce varying
multiple Color Gamuts on a display. The very accurate Basic Screen Mode, which
we tested here, is just one of four available Screen Modes on the Galaxy Note 4
that is selected under Display Settings (which many consumers and reviewers
seem to be unaware of). In addition, manufacturers will also need to finish
implementing fully automatic display calibration for each individual unit using
instruments (rather than partial or spot calibrations with visual tweaking).
Another major stumbling block for high Color Accuracy is
the bluish White Points with 7,000-8,500 K that lots of manufacturers and
consumers seem to like for their text backgrounds. That produces a bluish color
cast for all images that significantly degrades Color Accuracy, which needs a
6,500 K White Point. Color Management can also solve this by automatically
switching between different White Points for text and images, even when on the
same screen at the same time.
The leading
manufacturers are close to implementing much of this in the next generation of
displays. This will provide not only better Color Accuracy for your precious
digital photos and online purchases, but will also provide much needed
improvements for many specialized and professional
applications that will benefit from much better Color Accuracy, such as in
sales presentations, advertising, and especially medical imaging, where it can
improve diagnostics. Follow DisplayMate
on Twitter to learn about these developments and our upcoming display
technology coverage.
The Next Generation of Mobile
Displays
The best performing LCD and OLED displays are now
delivering impressive sharpness, brightness, low reflectance, high color
accuracy, accurate image contrast, and great viewing angles. So what comes
next? Essentially all published display specifications and factory calibrations
are based on performance in absolute darkness 0 lux, but mobile displays (and
even TVs) are seldom viewed in the dark. Even low levels of ambient light
significantly affect the image and picture quality. For example, the 100
percent sRGB Color Gamut specified by many manufacturers only applies at 0 lux.
At 500 lux, which corresponds to typical indoor office lighting, the on-screen
colors are washed out by the reflected ambient light, typically reducing the
on-screen Color Gamut from 100 percent down to 80 percent, plus the image
contrast is also significantly affected. And it gets worse as the ambient light
levels increase. So here is what needs to come next…
The most important improvements for both LCD and OLED
mobile displays will come from improving their image and picture quality and
screen readability in ambient light, which washes out the screen images,
resulting in reduced image contrast, color saturation, and color accuracy. The
key will be in implementing automatic real-time modification of the display’s
Color Gamut and Intensity Scales based the measured Ambient Light level in order
to have them compensate for the reflected light glare and image wash out from
ambient light as discussed in our 2014
Innovative Displays and Display Technology and SID
Display Technology Shoot-Out articles. LCDs will need Quantum
Dots in order to implement the necessary wide Color Gamuts. The displays, technologies, and manufacturers that succeed in
implementing this new high ambient light performance strategy will take the
lead in the next generations of mobile displays… Follow DisplayMate on Twitter to learn
about these developments and our upcoming display technology coverage.
Comparing the Individual Displays in Detail
You can compare the individual Display
Color Accuracy Measurements for all six displays using the Links below
together with a tabbed web browser The entries are mostly identical with only
minor formatting differences, so it’s easy to make detailed comparisons.
Samsung Galaxy Note 4 Color
Accuracy Measurements
Microsoft
Surface Pro 3 Color Accuracy Measurements
Samsung Galaxy Tab S 10.5
Color Accuracy Measurements
Amazon Kindle Fire HDX 8.9
2013 Color Accuracy Measurements
Apple iPhone 6 Plus Color
Accuracy Measurements
Apple iPad Air 2 Color
Accuracy Measurements
DisplayMate Display Optimization Technology
All
Smartphone and Tablet displays can be significantly improved using
DisplayMate’s proprietary very advanced scientific analysis and mathematical
display modeling and optimization of the display hardware, factory calibration,
and driver parameters. We help manufacturers with expert display procurement,
prototype development, testing displays to meet contract specifications, and production
quality control so that they don’t make mistakes similar to those that are
exposed in our public Display Technology Shoot-Out series for consumers. This
article is a lite version of our advanced scientific analysis – before the
benefits of our DisplayMate
Display Optimization Technology, which can correct or improve all of these
issues. If you are a display or product manufacturer and want to significantly
improve display performance for a competitive advantage then Contact DisplayMate Technologies.
About the Author
Dr. Raymond Soneira is
President of DisplayMate Technologies Corporation of Amherst, New Hampshire,
which produces display calibration, evaluation, and diagnostic products for
consumers, technicians, and manufacturers. See www.displaymate.com. He is a research
scientist with a career that spans physics, computer science, and television
system design. Dr. Soneira obtained his Ph.D. in Theoretical Physics from
Princeton University, spent 5 years as a Long-Term Member of the world famous
Institute for Advanced Study in Princeton, another 5 years as a Principal
Investigator in the Computer Systems Research Laboratory at AT&T Bell
Laboratories, and has also designed, tested, and installed color television
broadcast equipment for the CBS Television Network Engineering and Development
Department. He has authored over 35 research articles in scientific journals in
physics and computer science, including Scientific American. If you have any
comments or questions about the article, you can contact him at dtso.info@displaymate.com.
DisplayMate Display Optimization Technology
All
Smartphone and Tablet displays can be significantly improved using
DisplayMate’s proprietary very advanced scientific analysis and mathematical
display modeling and optimization of the display hardware, factory calibration,
and driver parameters. We help manufacturers with expert display procurement,
prototype development, testing displays to meet contract specifications, and
production quality control so that they don’t make mistakes similar to those
that are exposed in our public Display Technology Shoot-Out series for
consumers. This article is a lite version of our advanced scientific analysis –
before the benefits of our DisplayMate
Display Optimization Technology, which can correct or improve all of these
issues. If you are a display or product manufacturer and want to significantly
improve display performance for a competitive advantage then Contact DisplayMate Technologies.
About DisplayMate Technologies
DisplayMate Technologies specializes in proprietary advanced
scientific display calibration and mathematical display optimization to deliver
unsurpassed objective performance, picture quality and accuracy for all types
of displays including video and computer monitors, projectors, HDTVs, mobile
displays such as Tablets and Smartphones, and all display technologies
including LCD, LCD, 3D, LED, LCoS, Plasma, DLP and CRT. This article is a lite version of
our intensive scientific analysis of Smartphone and Tablet mobile displays –
before the benefits of our advanced mathematical DisplayMate Display Optimization
Technology, which can correct or improve many of the display deficiencies. We offer DisplayMate display
calibration software for consumers and advanced DisplayMate display diagnostic
and calibration software for technicians and test labs.
For
manufacturers we offer Consulting Services that include advanced Lab testing
and evaluations, confidential Shoot-Outs with competing products, calibration
and optimization for displays, cameras and their User Interface, plus on-site
and factory visits. We help manufacturers with expert display procurement,
prototype development, and production quality control so they don’t make
mistakes similar to those that are exposed in our Display Technology Shoot-Out
series. See our world renown Display
Technology Shoot-Out public article series for an introduction and preview.
DisplayMate’s
advanced scientific optimizations can make lower cost panels look as good or
better than more expensive higher performance displays. If you are a display or
product manufacturer and want to turn your display into a spectacular one to
surpass your competition then Contact
DisplayMate Technologies to learn more.
Article Links: TV Display Technology Shoot-Out
Article Series Overview and Home Page
Article Links: 2014
Innovative Displays and Display Technologies
Copyright © 1990-2014 by DisplayMate
Technologies Corporation. All Rights Reserved.
This article, or any part
thereof, may not be copied, reproduced, mirrored, distributed or incorporated
into any other work without
the prior written permission of DisplayMate Technologies Corporation