Windows Tablet Display Technology Shoot-Out
Microsoft Surface 2 –
Nokia Lumia 2520
Dr. Raymond M. Soneira
President, DisplayMate Technologies
Corporation
Copyright © 1990-2013 by DisplayMate
Technologies Corporation. All Rights Reserved.
This article, or any part
thereof, may not be copied, reproduced, mirrored, distributed or incorporated
into any other work without
the prior written permission of DisplayMate Technologies Corporation
Introduction
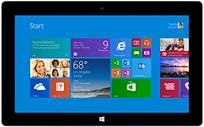
A new generation of Windows Tablets has arrived with the launch of the Microsoft Surface 2, their
second generation Tablet, and the Nokia Lumia
2520, Nokia’s first ever Tablet. With
virtually identical functionality and OS software, it is the quality and
performance of their displays that really differentiates the Tablets.
Microsoft’s original Surface RT launched in October 2012 had a display similar to the
older Apple iPad 2, with a resolution of 1366x768 pixels and a small Color
Gamut with just 57% of the Standard Gamut needed for accurate color
reproduction. That was a notch down from Apple’s existing iPad 3, with a much
higher 2048x1536 resolution, a much higher almost perfect 99% full Color Gamut,
and an excellent calibration that produced sharp, accurate, and beautiful image
and picture quality. The new Surface 2 has moved up to a Full HD 1920x1080 resolution,
which guarantees sharp images – but what else (if anything) has been improved?
The Lumia 2520 also has a similar 1920x1080 Full HD display that is 10.1
inches, half an inch smaller than the Surface 2. However, just like their
Smartphones, Nokia is emphasizing the display’s performance in high ambient
light with “Enhanced outdoor readability,” most likely indicating a very bright
and low reflectance screen. This could a significant development because most
existing Tablets suffer from mediocre degraded performance in ambient light, an
issue that we will analyze below.
In addition to displaying sharp text and graphics, Tablets are
frequently used for viewing multimedia content, so there are many other equally
important and even more challenging issues for Tablet displays besides
sharpness:
1. Picture quality as
good or better than your HDTV (to entice you to watch downloaded TV and movie
content).
2. Excellent true color
accuracy and accurate image contrast for high fidelity photos and images for all
content.
3. Improved screen
performance in high ambient light since Tablets aren’t used in the dark.
We’ll cover these issues and much more, with in-depth comprehensive
display tests, measurements and analysis that you will find nowhere else.
The Shoot-Out
To examine the display performance of the Microsoft Surface 2 and the
Nokia Lumia 2520 we ran our in-depth series of Mobile Display Technology
Shoot-Out Lab tests. We take display quality very seriously and provide
in-depth objective analysis and side-by-side comparisons based on detailed
laboratory measurements and extensive viewing tests with both test patterns and
test images. To see how far mobile displays have progressed in just three years
see our 2010
Smartphone Display Shoot-Out and 2011 Tablet Display
Shoot-Out, and for a real history lesson see our original 2006 Smartphone
Display Shoot-Out.
Results Highlights
In this Results section we provide Highlights of the
comprehensive Lab measurements and extensive side-by-side visual comparisons
using test photos, test images and test patterns that are presented below. The Comparison
Table section summarizes the Lab measurements in the following categories:
Screen
Reflections, Brightness
and Contrast, Colors
and Intensities, Viewing
Angles, Display
White Spectrum, Display
Power Consumption. You can also skip the Highlights and go directly to the Conclusions.
For
additional background and information see our 2013 Flagship Tablet Display
Shoot-Out, the 2012 Mini Tablet Display
Shoot-Out, our SID
Tablet Display Technology Shoot-Out, and the original 2012 Microsoft
Surface RT Display Shoot-Out.
Overview of the Surface 2
The Surface 2 is Microsoft’s second generation Windows
Tablet. The new high resolution 1920x1080 Full HD display delivers sharp text
and graphics, particularly with Microsoft’s ClearType Sub-Pixel Rendering,
which provides enhanced sharpness for black and white text and graphics. This
is especially important for the core suite of Microsoft Office applications.
Unfortunately, that’s about it for improvements in the Surface 2 display. In
fact, many of primary display specs are now 5 to 10 percent worse than the
first generation2012 Surface RT that we
tested, including Brightness, Contrast Ratio, Contrast Rating for High
Ambient Light, Specular Reflectance, and White Point. The Color Gamut has
improved from 57 to 63 percent. But shockingly, aside from the increased
resolution, the display remains comparable to the 2½ year old iPad 2 instead of
the latest generation of Full Size Apple and Android Tablets that we recently
tested. In fact, the Surface 2 display performs almost exactly like a
larger version of the recently introduced iPad mini
Retina Display that we recently cited for exactly the same outdated
display. More on these issues below.
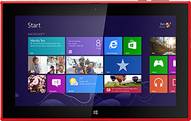
Overview of the Lumia 2520
The Lumia 2520 is Nokia’s first Tablet. It also has a
1920x1080 Full HD display with ClearType Sub-Pixel Rendering that delivers
sharp text and graphics like the Surface 2. But Nokia has in addition pushed
their display into record territory by producing the brightest mobile display
we have ever tested with an incredible maximum brightness of 684 cd/m2
(sometimes called nits). That takes impressive thermal and power management. It
is 74 percent brighter than the Surface 2 with a maximum 394 cd/m2
and 52 percent brighter than the iPad Air with a maximum 449 cd/m2.
Together with its very low screen Reflectance the Lumia 2520 has by far the
best high ambient light screen performance and readability of any Tablet
display that we have ever tested. The Lumia 2520 has a 75 percent Color Gamut,
which is 20 percent larger than the Surface 2, but 25 percent below the 100
percent Color Gamuts on many of the latest Tablets. The smaller Color Gamut is
(at least in part) the result of compromises needed to deliver very high
brightness.
But… all of the Color Gamut values are determined in
absolute darkness 0 lux, while Tablets are typically used anywhere from
moderate indoor up through very high outdoor ambient light. levels. As we’ll
see below, the Lumia’s actual visual Color Gamut rapidly improves compared to
other Tablets under real ambient lighting conditions until it exceeds their
performance due to its very high maximum brightness and low Reflectance. It’s
an impressive display delivering impressive performance in real world ambient
light. More on these issues below.
Display Sharpness and Sub-Pixel Rendering
Both Tablets have Full High Definition 1920x1080
displays, with the same number of pixels as your 50 inch HDTV, but on a 10 inch
screen, which is certainly impressive. With 208 to 218 Pixels Per Inch screens,
for 20/20 Vision the pixels are not resolved for viewing distances of 16 inches
or more, which is a bit larger than typical viewing distances that may extend
down to 13 inches. In practice that is perfectly fine for everyone, even for
those of you with better than 20/20 Vision. The reason is that pixelation and
sharpness are very important primarily just for computer generated text and
graphics because of their precise pixel arrangements, while photographic images
are inherently fuzzy because their image detail is spread over multiple pixels.
Windows displays have ClearType, which is Microsoft’s implementation of
Sub-Pixel Rendering, where the individual Red, Green and Blue Sub-Pixels are
treated as independent addressable image elements and are not all bound
together into specific Pixels. In some cases, particularly for black and white
text and graphics, Sub-Pixel Rendering can make the screen appear to have up to
3 times the resolution of Pixel Rendering. As a result, these Windows Tablets
have displays that appear perfectly sharp.
Display Brightness
Because Tablets are
frequently used under a very wide range of ambient lighting, a display that can
deliver very high Maximum Brightness is extremely important and a major
advantage because not only does that improve the screen’s readability, but also the image contrast, image colors and color
saturation, and overall image and picture quality that you’ll see under your
actual real viewing conditions, both indoors and outdoors.
The display on the Nokia Lumia 2520 provides record high
ambient light performance and screen readability, with by far the brightest
mobile display we have ever tested with an incredible maximum brightness of 684
cd/m2 (sometimes called nits). It is 74 percent brighter than the
Surface 2 with 394 cd/m2 and 52 percent brighter than the iPad Air
with 449 cd/m2. Note that it is important to appropriately adjust
the display brightness in order to preserve battery power and running time, and
also to reduce eye strain from looking at too bright a display. See the Brightness
and Contrast section for details.
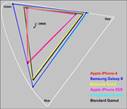
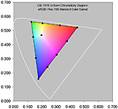
Color Gamut
The Color Gamut is the range of colors that a display can
produce. In order to show accurate on-screen colors the display must match the
Standard sRGB/Rec.709 Color Gamut that is used to produce virtually all
consumer content. Note that consumer content does not include colors outside of
the Standard Gamut, so a display with a wider Color Gamut cannot show colors
that aren't in the original and will only produce inaccurate exaggerated
on-screen colors – so in this instance, bigger than 100 percent is not better.
The measured Color Gamuts for these Tablets are shown in Figure 1.
The Lumia 2520 has a 75 percent Color Gamut, which is 20
percent larger than the Surface 2, but 25 percent below the 100 percent Color
Gamuts on many of the latest Tablets. The differences between all of these were
quite noticeable in the Viewing Tests described below. However, it is important
to note that the Color Gamuts are determined in absolute darkness 0 lux and
change significantly even in low levels of ambient lighting. As a result of its
very high Brightness, the relative Color Gamut of the Lumia 2520 improves
significantly in ambient light compared to other Tablets, which we discuss
next. Compare the Color Gamuts in Figure 1 and in the Colors
and Intensities section.
Screen Reflectance and Performance in High Ambient Lighting
The
screens on almost all Tablets and Smartphones are mirrors good enough to use
for personal grooming. Even in moderate ambient lighting the sharpness and
colors can noticeably degrade from light reflected by the screen, especially
objects like your face and any bright lighting behind you. Screen Reflectance
has been steadily decreasing. Both the Surface 2 and Lumia 2520 have low
Reflectance under 6 percent, which is excellent.
Tablets are almost
never used in the dark. The display’s performance in ambient lighting depends
on a combination of both its Maximum Brightness and the screen Reflectance,
called the Contrast Rating for High Ambient Light (see below for details). The higher the measured Contrast
Rating for High Ambient Light for a display, the better the image contrast,
image colors, screen readability, and overall image and picture quality that
you’ll see under ambient light viewing conditions, both indoors and outdoors.
The Lumia 2520 has a
Contrast Rating for High Ambient Light of 120, by far the largest we have ever
measured for a Tablet. The Surface 2 has a much lower value of 67, so its high
ambient light performance will be significantly poorer.
While the Lumia’s Color
Gamut is 25 percent smaller than many multimedia Tablets, that only applies in
the dark. At 1,000 lux, which corresponds to bright indoor lighting, the Gamut
difference decreases to just 9 percent with the iPad Air. But more impressive
is that the Lumia’s Contrast Ratio at 1,000 lux is already 78 percent larger
than the iPad’s. At 2,000 lux, which corresponds to low level outdoor lighting,
the Lumia’s Color Gamut is larger than the iPad’s and then keeps getting
comparatively better as the ambient light level increases.
The effect of ambient
light is much greater on the Surface 2 due to its much lower Brightness and
Contrast Rating for High Ambient Light. At 2,000 lux the Lumia’s Color Gamut is
56 percent larger than the Surface 2 and its Contrast Ratio is 81 percent
larger than the Surface 2, and the disparity keeps increasing with ambient
light level.
To learn more see
this article on display performance in ambient light. This article
has screen shots that show how screen images degrade from reflections in bright
ambient light. See the Screen
Reflections section for details.
Viewing Angle Performance
While Tablets are
primarily single viewer devices, the variation in display performance with
viewing angle is still very important because single viewers frequently hold
the display at a variety of viewing angles, plus they are large enough for
sharing the screen with others. Both Tablets have displays with high
performance IPS (or equivalent) LCD technology, so they were expected to show
very little color shift with viewing angle, and our Lab measurements confirmed
their excellent Viewing Angle performance, with no visually noticeable color
shifts. However, all LCDs, do have a strong decrease in brightness (Luminance)
with Viewing Angle, and both displays showed, as expected, more than a 50
percent decrease in brightness at a modest 30 degree Viewing Angle. See the Viewing
Angles section for details.
Absolute Color Accuracy
Getting
very accurate screen image colors is very important and also very difficult
because the display and calibration all need to be done extremely well at the
factory. We have performed a set of detailed Lab spectroradiometer measurements
of the Tablet displays to see how accurately they reproduce a set of 21
Reference Colors within the Standard sRGB/Rec.709 Color Gamut. The Reference
Colors and the colors actually reproduced by the Windows Tablets are shown in Figure 2.
The
Color Accuracy Errors are examined in terms of JNCD (Just Noticeable Color
Difference). As a result of the 63 percent Color Gamut for the Surface 2
and 75 percent Color Gamut for the Lumia 2520 the Color Errors are much larger
than for displays with 100 percent Gamuts. Again, it is important to note that
these results are for absolute darkness at 0 lux, and become worse (to varying
degrees) for all displays with increasing ambient light. See Figure 2 for a discussion
of JNCD with plots of the Reference Colors and the actually reproduced colors,
and the Colors
and Intensities section for the numerical results.
Viewing Tests
The smaller Color Gamuts on both the Surface 2 and Lumia
2520 were quite noticeable in the Viewing Tests, which consisted side-by-side
comparisons of a large selection of challenging photos with a calibrated
display that has essentially perfect Absolute Color Accuracy and Image
Contrast. Colors on the Surface 2 appeared particularly subdued, significantly
more than on the Lumia 2520 as expected from the measured Color Gamuts. Greens
were particularly vibrant on the Lumia and noticeable washed out on the Surface
2. The reds in fire engines, tomatoes, and even on a coke can appeared somewhat
orange rather than a deep red, more so on the Surface 2 than on the Lumia 2520,
which was noticeably better. See Figure 1 and Figure 2 and the Colors
and Intensities section for quantitative details.
Conclusions: One Impressive Tablet Display
and One Disappointment…
Both of these second generation Windows Tablets have high
resolution 1920x1080 Full HD displays that deliver sharp text and graphics,
particularly with Microsoft’s ClearType Sub-Pixel Rendering, which provides
enhanced sharpness for black and white text and graphics. This is especially
important for the core suite of Microsoft Office applications. But after that
the displays on these Tablets have very different levels of performance…
Tablets are almost
never used in the dark. Their screens reflect ambient light that washes out the
colors and image contrast, and makes it harder to read the screen, especially
with (specular) mirror reflections. These are significant effects indoors as
well as outdoors. To see by how much, turn off the display but hold the Tablet
as if you’re using it and then walk around your normal environment, both
indoors and outdoors and see everything that it reflects. The higher the
measured Contrast Rating for High Ambient Light for a display, the better the image contrast, image colors,
screen readability, and overall image and picture quality that you’ll see under
your actual real viewing conditions, both indoors and outdoors.
The display on the Nokia Lumia 2520 provides record high ambient light
performance and screen readability, with by far the brightest mobile display we
have ever tested with an incredible maximum brightness of 684 cd/m2
(sometimes called nits). It is 74 percent brighter than the Surface 2 with 394
cd/m2 and 52 percent brighter than the iPad Air with 449 cd/m2.
Together with its low 5.7 percent screen Reflectance it has a Contrast Rating
for High Ambient Light of 120, by far the largest we have ever measured for a
Tablet.
While the Lumia’s Color
Gamut is 25 percent smaller than many multimedia Tablets, that only applies in
the dark. At 1,000 lux, which corresponds to bright indoor lighting, the Gamut
difference decreases to just 9 percent with the iPad Air. But more impressive
is that the Lumia’s Contrast Ratio at 1,000 lux is already 78 percent larger
than the iPad’s. At 2,000 lux, which corresponds to low level outdoor lighting,
the Lumia’s Color Gamut is larger than the iPad’s and then keeps getting
comparatively better as the ambient light increases. To learn more see
this article on display performance in ambient light.
The display
on the Microsoft Surface 2 delivers excellent
performance for text based applications like Microsoft Office. But other than
its higher screen resolution, the Surface 2 display is actually somewhat worse
than last year’s original Surface RT that we
tested, with many of the primary display specs now 5 to 10 percent worse.
Its Color Gamut is just 63 percent of the Standard Gamut, which results in
noticeably bland and mediocre multimedia colors and picture quality. Its
Maximum Brightness of 394 cd/m2 and Contrast Rating for High Ambient
Light of 67 are also middle of the road, resulting in mediocre performance in
Ambient Light. Other than its higher resolution, the Surface 2 is comparable to
the 2½ year old iPad 2 instead of the latest generation of Full Size Apple and
Android Tablets that we recently tested.
With virtually
identical functionality and OS software, it is the quality and performance of
the displays that really differentiates these Windows Tablets. The display on
the Nokia Lumia 2520 is impressive while the Microsoft Surface 2 is mediocre
and a disappointment…
What’s Next…
There is still tremendous room for improvement and
innovation in display technology, which I have covered in recent articles on super high density
440+ PPI displays, Curved and
Flexible Displays, OLED mobile
displays and OLED
TV displays, plus a new technology called Quantum Dots will
play a very important critical role for LCDs.
The most important developments for the upcoming
generations of mobile displays will come from improvements in their image and
picture quality in ambient light, which washes out screen images, resulting in
reduced readability, image contrast, and color saturation and accuracy. The key
will be in dynamically changing the display’s color management and intensity
scales in order to automatically compensate for reflected glare and image wash
out from ambient light. See
this article on display performance in ambient light. The displays and
technologies that succeed in implementing this new strategy will take the lead
in the next generations of mobile displays…
DisplayMate Display Optimization Technology
All
Smartphone and Tablets displays can be significantly improved using
DisplayMate’s advanced scientific analysis and mathematical display modeling
and optimization of the display hardware, factory calibration, and driver
parameters. We help manufacturers with expert display procurement, prototype
development, and production quality control so they don’t make mistakes similar
to those that are exposed in our Display Technology Shoot-Out series. We can
also improve the performance of any specified set of display parameters. This
article is a lite version of our intensive scientific analysis – before the
benefits of our DisplayMate
Display Optimization Technology, which can correct or improve all of these
issues. If you are a display or product manufacturer and want to significantly
improve display performance for a competitive advantage then Contact DisplayMate Technologies.
Display Shoot-Out Comparison Table
Below we compare
the displays on the Microsoft Surface 2 and the Nokia Lumia 2520
based on objective Lab measurement data and criteria. For additional background
and information see our 2013 Flagship Tablet Display
Shoot-Out, the 2013 Mini Tablet Display
Shoot-Out, our SID
Tablet Display Technology Shoot-Out, and the original 2012 Microsoft
Surface RT Display Shoot-Out.
|
Categories
|
Microsoft
Surface
2
|
Nokia
Lumia
2520
|
Comments
|
|
Display Technology
|
10.6 inch
LCD
|
10.1 inch
IPS LCD
|
Liquid Crystal Display
In Plane Switching
|
|
Screen Shape
|
16:9 =
1.78
Aspect
Ratio
|
16:9 =
1.78
Aspect
Ratio
|
The 16:9 Aspect Ratio of the displays is
a
perfect match for widescreen video.
|
|
Screen Area
|
48.0
Square Inches
|
43.6
Square Inches
|
A better measure of size than the
diagonal length.
|
|
Relative Screen Area
|
110
percent
|
100
percent
|
Screen Area relative to the Lumia 2520.
|
|
Display Pixel Resolution
|
1920 x
1080 pixels
with
Sub-Pixel Rendering
|
1920 x
1080 pixels
with
Sub-Pixel Rendering
|
Screen Pixel Resolution.
Sub-Pixel Rendering is Discussed above.
|
|
Total Number of Pixels
|
2.1 Mega
Pixels
|
2.1 Mega
Pixels
|
Total Number of Pixels.
|
|
Pixels Per Inch
|
208 PPI
Very Good
|
218 PPI
Very Good
|
Sharpness depends on the viewing distance
and PPI.
See this on
the visual acuity for a true
|
|
20/20 Vision Distance
where Pixels are Not Resolved
|
16.5
inches
or more
|
15.8
inches
or more
|
For 20/20 Vision the minimum Viewing
Distance
where the screen appears perfectly sharp
to the eye.
At 15 inches from the screen 20/20 Vision
is 229 PPI.
|
|
Photo Viewer Color Depth
|
Full
24-bit color
No
Dithering Visible
256
Intensity Levels
|
Full
24-bit color
No
Dithering Visible
256
Intensity Levels
|
Many Android devices still have some
form
of 16-bit color depth
in the Gallery Photo Viewer.
|
|
Overall Assessments
This section summarizes the results of all of the
extensive Lab measurements and viewing tests performed on the displays.
|
|
|
Surface
2
|
Lumia
2520
|
Comments
|
|
Viewing Tests
in Subdued Ambient Lighting
|
Good
Images
Photos and
Videos
have
reduced color
and
accurate contrast
|
Very Good
Images
Photos and
Videos
have
slightly reduced color
and
accurate contrast
|
The Viewing Tests examined the accuracy
of
photographic images by comparing the
displays
to a calibrated studio monitor and HDTV.
|
|
Variation with Viewing Angle
|
Small
Color Shifts
with
Viewing Angle
Large
Brightness Shift
with
Viewing Angle
|
Small
Color Shifts
with
Viewing Angle
Large
Brightness Shift
with
Viewing Angle
|
Both displays have Small Color Shifts
and a Large Brightness decrease with
Viewing Angle, which is typical for
high performance LCDs.
See Viewing
Angles for details.
|
|
Overall Lab Assessment
Lab Tests and Measurements
|
Good Display
Small Color
Gamut
|
Very Good Display
Very Bright Display
Excellent in High
Ambient Light
Reduced
Color Gamut
|
See Screen
Reflections for details.
See Brightness
and Contrast for details.
See Colors
and Intensities for details.
|
|
Absolute Color Accuracy
|
Poor Color Accuracy
Small Color
Gamut
|
Good Color Accuracy
Reduced
Color Gamut
|
See Figure 2 and Colors
and Intensities for details.
|
|
Image Contrast Accuracy
|
Very Good Contrast
Accuracy
Slightly
Variable
|
Very Good Contrast
Accuracy
Slightly
Variable
|
See Figure 3 and Brightness
and Contrast for details.
|
|
Overall Display Calibration
Lab Tests and Viewing Tests
|
Good
Calibration
White Point Too Blue
Small Color
Gamut
|
Very Good Calibration
Reduced
Color Gamut
|
The Lumina 2520 was better calibrated,
which
was easy to see in both the Lab Tests and
the
Viewing Tests.
|
|
Overall Display Assessment
|
B
Good Display
Small Color
Gamut
|
A –
Very Good Display
Very Bright Display
Excellent in High
Ambient Light
Reduced
Color Gamut
|
The Lumia 2520 excels in Brightness,
Contrast Rating,
High Ambient Light Performance, with a
significantly
larger Color Gamut, and leads in most
Categories.
The Surface 2 has significantly lower
Brightness,
Contrast Rating, High Ambient Light
Performance,
and Color Gamut, and trails in most
Categories.
|
|
Screen Reflections
All of these screens are large mirrors good enough
to use for personal grooming – but it’s actually a very bad feature…
We measured the light reflected from all directions
and also direct mirror (specular) reflections, which are much more
distracting and cause more eye strain. Many Tablets
still have greater than 10 percent reflections that make the
screen much harder to read even in moderate ambient
light levels, requiring ever higher brightness settings that
waste precious battery power. Hopefully
manufacturers will continue to reduce the mirror reflections with
anti-reflection
coatings and matte or haze surface finishes.
|
|
|
Surface
2
|
Lumia
2520
|
Comments
|
|
Average Screen Reflection
Light From All Directions
|
Reflects
5.9 percent
Excellent
|
Reflects
5.7 percent
Excellent
|
Measured using an Integrating
Hemisphere.
The best Tablet value we have measured
is 5.0
percent and the current worst is 14.8
percent.
|
|
Relative Brightness of the
Reflected Ambient Light
|
104
percent
|
100
percent
|
Relative Brightness of the Reflected
Ambient Light
expressed as a percentage of the lowest
amount.
|
|
Mirror Reflections
Percentage of Light Reflected
|
7.6 percent
Very Good
|
7.1 percent
Very Good
|
These are the most annoying types of
reflections.
Measured using a narrow collimated
pencil beam
of light reflected off the screen.
|
|
Brightness and Contrast
The Contrast Ratio is the specification that gets
the most attention, but it only applies for low ambient light, which is
seldom
the case for mobile displays. Much more important
is the Contrast Rating, which indicates how easy it is to read the screen
under high ambient lighting and depends on both the
Maximum Brightness and the Screen Reflectance.
|
|
|
Surface
2
|
Lumia
2520
|
Comments
|
|
Measured Maximum Brightness
Peak Luminance for White
|
Brightness
394 cd/m2
Very Good
|
Brightness
684 cd/m2
Excellent
|
This is the Brightness for a screen that
is entirely
all white with 100% Average Picture
Level.
|
|
Relative Maximum Brightness
|
58 percent
Much Lower
|
100
percent
Best
|
Relative Maximum Brightness expressed as
a percentage of the Brightest display.
|
|
|
|
Dynamic Black Level at 0 lux
at Maximum Brightness
For Full Screen Black Only
|
0.40 cd/m2
Very Good
for Mobile
|
0.54 cd/m2
Very Good
for Mobile
|
Dynamic Brightness can reduce or even turn off
the Backlight during Full Screen Black.
|
|
True Black Level at 0 lux
at Maximum Brightness
For Typical Screen Content
|
0.40 cd/m2
Very Good
for Mobile
|
0.54 cd/m2
Very Good
for Mobile
|
This is the True Black Level for most images
rather than the Dynamic Black on a full screen.
|
|
True Contrast Ratio at 0 lux
Relevant for Low Ambient Light
|
985
Very Good
for Mobile
|
1,267
Very Good
for Mobile
|
Only relevant for Low Ambient Light
levels,
which is seldom the case for mobile devices.
|
|
Relative Contrast Ratio
for Low Ambient Light
|
78 percent
Much Lower
|
100
percent
Best
|
Relative True Contrast Ratio for Low
Ambient Light
expressed as a percentage of the highest
value..
|
|
|
|
Contrast Rating
for High Ambient Light
|
67
Very Good
|
120
Excellent
|
Depends on the Screen Reflectance and
Brightness.
Defined as Maximum Brightness / Average Reflectance.
See this SID
article for a detailed explanation.
|
|
Relative Contrast Rating
for High Ambient Light
|
56 percent
Much Lower
|
100
percent
Best
|
Relative Contrast Rating for High
Ambient Light
expressed as a percentage of the highest
value.
|
|
Screen Viewability
in High Ambient Light
|
A –
Very Good
|
A +
Excellent
|
Indicates how easy it is to view the
screen
under high ambient lighting. Depends on
both the Screen Reflectance and Brightness.
See High
Ambient Light Screen Shots
|
|
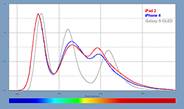
Colors and Intensities
The Color Gamut, Intensity Scale, and White Point
determine the quality and accuracy of all displayed images and all
the image colors. Bigger is definitely Not Better
because the display needs to match all the standards that were used
when the content was produced. For LCDs a wider
Color Gamut reduces the power efficiency and the Intensity Scale
affects both image brightness and color mixture
accuracy. See the above Figures for detailed explanations.
|
|
|
Surface
2
|
Lumia
2520
|
Comments
|
|
White Color Temperature
Degrees Kelvin
See Figure 1
|
7,740 K
Somewhat
Too Blue
See Figure 1
|
6,410 K
Close to
Standard
See Figure 1
|
D65 with 6,500 K is the standard color
of White
for most Content and needed for accurate
color
reproduction.
See Figure 1
for the plotted White Points.
|
|
Color Gamut
Percent of Standard Gamut
Measured in the dark at 0 lux
See Figure 1
|
63 percent
Color
Gamut Too Small
See Figure 1
|
75 percent
Color
Gamut Somewhat Small
See Figure 1
|
sRGB / Rec.709 is the color standard for
most
content and needed for accurate color
reproduction.
Note that Too Large a Color Gamut can be
visually
worse than Too Small. See Figure 1
|
|
|
|
Absolute Color Accuracy
Average Color Error
for 21 Reference Colors
Just Noticeable Color Difference
See Figure 2
|
Average
Error 7.2 JNCD
Poor
See Figure 2
|
Average
Error 6.6 JNCD
Good
See Figure 2
|
JNCD is a Just Noticeable Color Difference.
See Figure 2 for the
definition of JNCD.
Average Errors below 3.5 JNCD are Very
Good.
Average Errors above 7.0 JNCD are Poor.
|
|
Absolute Color Accuracy
Largest Color Error
for 21 Reference Colors
Just Noticeable Color Difference
See Figure 2
|
Largest
Error 19.2 JNCD
Poor
See Figure 2
|
Largest
Error 13.8 JNCD
Good
See Figure 2
|
JNCD is a Just Noticeable Color Difference.
See Figure 2 for the
definition of JNCD.
Largest Errors below 7.0 JNCD are Very
Good.
Largest Errors above 14.0 JNCD are Poor.
This is twice the limit for the Average
Error.
|
|
|
|
Dynamic Brightness
Luminance Reduction with
Average Picture Level APL
|
0 percent
Excellent
|
0 percent
Excellent
|
This is the percent Brightness reduction
with APL
Average Picture Level. Ideally should be
0 percent.
|
|
Intensity Scale and
Image Contrast
See Figure 3
|
Intensity
Very Smooth
Slightly
Variable
Bright End
is Too Steep
See Figure 3
|
Intensity
Very Smooth
Slightly
Variable
Bright End
is Excellent
See Figure 3
|
The Intensity Scale controls Image
Contrast needed
for accurate image reproduction. See Figure 3.
|
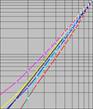
|
Gamma for the Intensity Scale
Larger has more Image Contrast
See Figure 3
|
Average
Gamma is 2.18
Varies
2.14 to 2.35
|
Average
Gamma is 2.18
Varies
2.12 to 2.24
|
Gamma is the slope of the Intensity Scale.
Gamma of 2.20 is the standard and needed
for
accurate image reproduction. See Figure 3.
|
|
Viewing Angles
The variation of
Brightness, Contrast, and Color with Viewing Angle is especially important
for Tablets because of
their large screen and
multiple viewers. The typical manufacturer 176+ degree specification for LCD
Viewing Angle
is nonsense because that
is where the Contrast Ratio falls to a miniscule 10. For most LCDs there are
substantial
degradations at less
than ±30 degrees, which is not an atypical Viewing Angle for Smartphones and
Tablets.
Note that the Viewing
Angle performance is also very important for a single viewer because the
Viewing Angle varies
based on how the display
is held. The angle can be very large if resting on a table or desk.
|
|
|
Surface
2
|
Lumia
2520
|
Comments
|
|
Brightness Decrease
at a 30 degree Viewing Angle
|
56 percent
Decrease
Very Large
Decrease
|
54
percent Decrease
Very Large
Decrease
|
All LCDs appear much less bright when
tilted.
LCD decrease is generally greater than
50 percent.
|
|
True Contrast Ratio
at a 30 degree Viewing Angle
|
495
Portrait
665
Landscape
Very Good
for Mobile
|
779
Portrait
788
Landscape
Very Good
for Mobile
|
A measure of screen readability when the
screen
is tilted under low ambient lighting.
|
|
White Point Color Shift
at a 30 degree Viewing Angle
|
Small
Color Shift
Δ(u’v’)
= 0.0068
1.7 times
JNCD
|
Small
Color Shift
Δ(u’v’)
= 0.0050
1.2 times
JNCD
|
JNCD is a Just Noticeable Color Difference.
See Figure 2 for the
definition of JNCD.
|
|
Primary Color Shifts
Largest Shift for R,G,B
at a 30 degree Viewing Angle
|
Small
Color Shift
Δ(u’v’)
= 0.0035
0.9 times
JNCD
|
Small
Color Shift
Δ(u’v’)
= 0.0141
3.5 times
JNCD
|
JNCD is a Just Noticeable Color Difference.
See Figure 2 for the
definition of JNCD.
|
|
Color Shifts for Color Mixtures
at a 30 degree Viewing Angle
Reference Brown (255, 128, 0)
|
Small
Color Shift
Δ(u’v’)
= 0.0041
1.0 times
JNCD
|
Small
Color Shift
Δ(u’v’)
= 0.0096
2.4 times
JNCD
|
JNCD is a Just Noticeable Color Difference.
Color Shifts for non-IPS LCDs are about 10
JNCD.
Reference Brown is a good indicator of
color shifts
with angle because of unequal drive
levels and
roughly equal luminance contributions
from Red
and Green. See Figure 3 for the
definition of JNCD.
|
|
Display Power
Consumption
The display power was measured using a Linear
Regression between Luminance and AC Power with a fully charged battery.
Since the displays have different screen sizes and
maximum brightness, the values were also scaled to the
same screen brightness (Luminance) and screen area
in order to compare their relative Power Efficiencies.
|
|
|
Surface
2
|
Lumia
2520
|
Comments
|
|
Maximum Display Power
Full White Screen
at Maximum Brightness
|
2.0 watts
for 394 cd/m2
|
4.1 watts
for 684
cd/m2
|
This measures the display power for a
screen
that is entirely Peak White.
|
|
Relative Power Efficiency
Same Luminance 684 cd/m2
Same 10.1 inch screen area
|
3.2 watts
|
4.1 watts
|
This compares the Maximum Power
Efficiency
by scaling to the same screen brightness
and
same screen area as the Lumia 2520.
|
About the Author
Dr. Raymond Soneira is
President of DisplayMate Technologies Corporation of Amherst, New Hampshire,
which produces video calibration, evaluation, and diagnostic products for
consumers, technicians, and manufacturers. See www.displaymate.com. He is a research
scientist with a career that spans physics, computer science, and television
system design. Dr. Soneira obtained his Ph.D. in Theoretical Physics from
Princeton University, spent 5 years as a Long-Term Member of the world famous
Institute for Advanced Study in Princeton, another 5 years as a Principal
Investigator in the Computer Systems Research Laboratory at AT&T Bell
Laboratories, and has also designed, tested, and installed color television
broadcast equipment for the CBS Television Network Engineering and Development Department.
He has authored over 35 research articles in scientific journals in physics and
computer science, including Scientific American. If you have any comments or
questions about the article, you can contact him at dtso.info@displaymate.com.
DisplayMate Display Optimization Technology
All
Smartphone and Tablet displays can be significantly improved using
DisplayMate’s advanced scientific analysis and mathematical display modeling
and optimization of the display hardware, factory calibration, and driver
parameters. We help manufacturers with expert display procurement, prototype
development, and production quality control so they don’t make mistakes similar
to those that are exposed in our Display Technology Shoot-Out series. We can
also improve the performance of any specified set of display parameters. This
article is a lite version of our intensive scientific analysis – before the
benefits of our DisplayMate
Display Optimization Technology, which can correct or improve all of these
issues. If you are a display or product manufacturer and want to significantly
improve display performance for a competitive advantage then Contact DisplayMate Technologies.
About DisplayMate Technologies
DisplayMate Technologies specializes in proprietary
sophisticated scientific display calibration and mathematical display
optimization to deliver unsurpassed objective performance, picture quality and
accuracy for all types of displays including video and computer monitors,
projectors, HDTVs, mobile displays such as smartphones and tablets, and all
display technologies including LCD, OLED, 3D, LED, LCoS, Plasma, DLP and CRT. This article is a lite version of
our intensive scientific analysis of Smartphone and Smartphone mobile displays
– before the benefits of our advanced mathematical DisplayMate Display Optimization
Technology, which can correct or improve many of the display deficiencies. We offer DisplayMate display
calibration software for consumers and advanced DisplayMate display diagnostic
and calibration software for technicians and test labs.
For
Manufacturers we offer Consulting Services that include advanced Lab testing,
analysis and evaluations, confidential Shoot-Outs with competing products,
calibration and optimization for displays, improving the User Interface for the
entire display system, plus on-site and factory visits. We help manufacturers
with expert display procurement, prototype development, optimization, and
production quality control so they don’t make mistakes similar to those that
are exposed in our Display Technology Shoot-Out series. See our world renown Display Technology Shoot-Out
public article series for an introduction and preview. DisplayMate’s advanced
scientific optimizations can make lower cost panels look as good or better than
more expensive higher performance displays. If you are a display or product
manufacturer and want to turn your display into a spectacular one to surpass
your competition then Contact
DisplayMate Technologies to learn more.
Article Links: Display Technology Shoot-Out
Article Series Overview and Home Page
Copyright © 1990-2013 by DisplayMate
Technologies Corporation. All Rights Reserved.
This article, or any part
thereof, may not be copied, reproduced, mirrored, distributed or incorporated
into any other work without
the prior written permission of DisplayMate Technologies Corporation