Changes in TV Picture Quality with Viewing Position
Dr. Raymond M. Soneira
President, DisplayMate Technologies
Corporation
Copyright © 1990-2017 by DisplayMate
Technologies Corporation. All Rights Reserved.
This article, or any part
thereof, may not be copied, reproduced, mirrored, distributed or incorporated
into any other work without
the prior written permission of DisplayMate Technologies Corporation
Some LCD Technologies Show
Large Color Shifts with Viewing Position and Viewing Angle
|

|
|

|
|

|
|

|
|
0° Viewing Angle VA LCD
|
|
45° Viewing Angle VA LCD
|
|
0° Viewing Angle VA LCD
|
|
45° Viewing Angle VA LCD
|
Introduction
Large screen TVs are often watched by multiple viewers
from a wide range of viewing positions and viewing angles. A single viewer may
also watch TV from several different viewing positions. As a result, it is very
important that every viewer watching the TV should see the same high picture
quality regardless of their viewing position and angle – with everyone enjoying
accurate and consistent colors and contrast from wherever they are watching.
The best
place to watch any TV or any display is with the viewer sitting directly in
front of the center of the screen – which is called the “Sweet Spot” and only
one person can be there. Other TV viewers may see anywhere from a slight to
substantial picture degradation depending on how far away they are from the
Sweet Spot. All display technologies show some variation in picture quality
with viewing angle. Clearly, the smaller the variation with viewing angle the
better, so that all viewers see the same high quality picture as from the Sweet
Spot...
The range
of viewing positions and angles varies from home to home, and also worldwide.
Studies in several countries have found that 80% of the TV viewers are
generally within ±30° of the center of the screen, with most of the remaining 20%
within ±45°, and a small number extending all the way out to ±60°. In my own
home theater a favorite sofa results in a 45°
viewing angle.
However,
most TV viewers may not be aware of the changes in picture quality when they
move to a different viewing position because almost all TV content is
constantly changing. As a result, it can be hard to identify and track the
differences from each viewing position and angle. One good way to visually
evaluate the changes with viewing position is by putting up a still photograph
that has a wide range of color content and a wide range of picture brightness
and contrast, and then walk by the TV at a steady pace from the far left to far
right sides, noting the picture variations and changes that you see. We will
also discuss some ways to evaluate the viewing angle picture variations when
shopping for a TV at a store.
Below we’ll
start off with some screen shots to demonstrate the visual differences with
viewing angle, but in this article we will rely primarily on extensive Lab
tests and measurements to quantitatively compare the picture differences and
changes with viewing angle.
The Picture Changes with Viewing
Angle
·
The Picture Brightness in almost all cases
decreases as the viewing angle increases for all TV display technologies.
·
The Picture Contrast can either increase or
decrease with viewing angle depending on the TV’s display technology.
·
The Picture Color Gamut can either slightly increase or significantly decrease with viewing angle
depending on the TV’s display technology.
·
The Picture Color Shifts are the most visually
noticeable variations and changes with viewing angle, which depend on the
particular TV display technology. Both the Hue
and Saturation for each of the millions of colors contained within the entire
TV Color Gamut can shift by differing amounts when the viewing angle changes.
We will map them in detail below.
TV Display Technologies
Every
display technology has different performance characteristics with viewing
angle. The now extinct CRT and Plasma technologies had relatively small changes
with viewing angle (but lots of other issues, which is why they are extinct).
OLED TV displays also have relatively small changes with viewing angle, which
we have measured and analyzed in several earlier articles. LCDs currently
account for over 90% of all TVs, but most consumers are not aware that LCDs are
not a single display technology, but rather a broad range of different Liquid Crystal Display technologies with very different performance
characteristics, which we discuss next...
Different LCD Technologies
All LCDs have a uniform Backlight illumination that is
located behind the entire panel, followed by the active Liquid Crystal that is
contained between two glass substrates that are placed between front and back
light polarizers that block the Backlight illumination to varying degrees. For
every pixel an electric field changes the orientation of the Liquid Crystal,
which affects the polarization of the light passing through, and that in turn
determines the amount of light that comes through the front polarizer. Every
pixel is actually made up of individual Red, Green, and Blue sub-pixels with
color light filters that add color to the image. But the LCD technologies work
differently...
There
are 3 principal classes of LCD technology:
·
TN
Twisted Nematic is
the earliest and most basic LCD technology where the Liquid Crystal is twisted
by the electric field produced for each sub-pixel. It is still being used in
low cost displays, including many laptops, but is no longer used in TVs because
it has extremely large brightness, contrast, and color shifts with viewing
angle.
·
VA
Vertical Alignment
is a widely used LCD technology where the Liquid Crystal is vertically aligned
perpendicular to the glass substrate with an orientation that changes with the
electric field produced for each sub-pixel. VA LCDs are widely used in TVs and
monitors. Its major advantage is a high Contrast Ratio, but as we’ll see below
it has significant Color Shifts and Contrast Shifts with viewing angle.
The Tested LCD TVs
In this article we will compare in detail the viewing
angle variations and performance of two TVs with different LCD technologies:
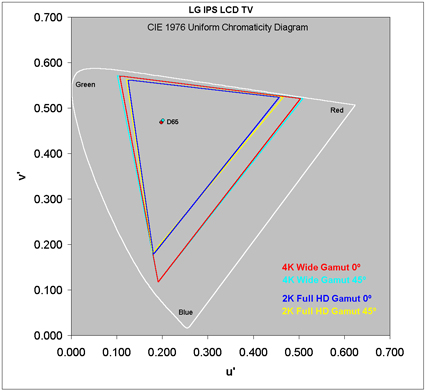
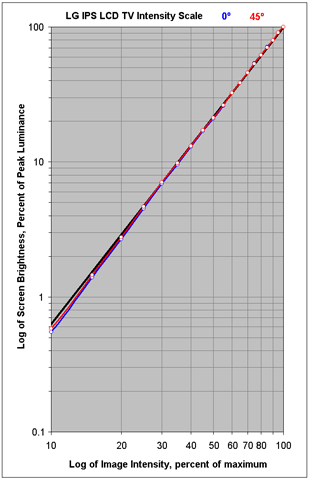
· IPS LCD technology: LG 65SJ9500 Nano Cell 65 inch TV
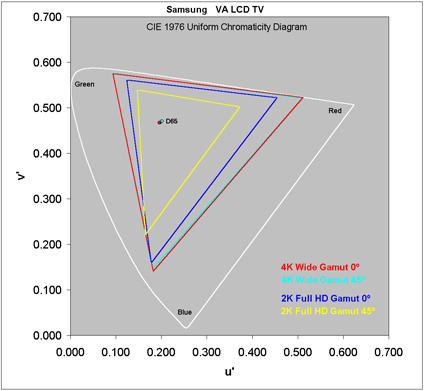
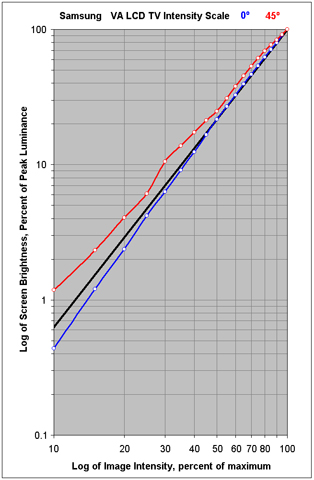
· VA LCD technology: Samsung 65Q8 Quantum Dot 65 inch TV
Both TVs
use Nano-technology to enhance their Color Gamut and Color Saturation. The LG
TV has Nano Cells in front of the LCD panel, and the Samsung TV has Quantum
Dots in the Backlight behind the LCD panel.
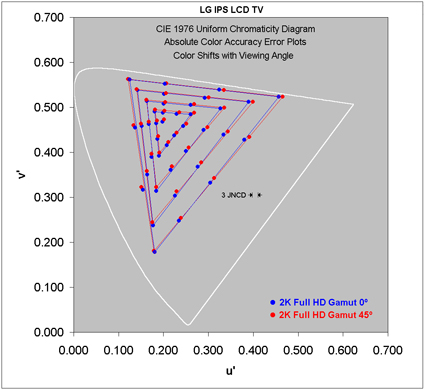
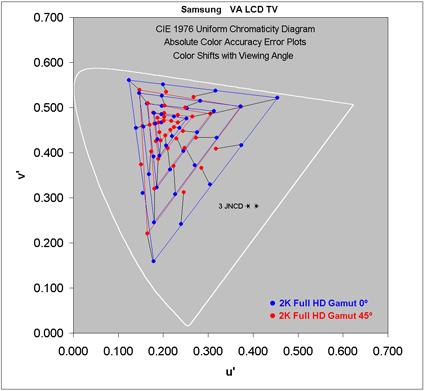
Evaluating TV Viewing Angle Picture and Performance
To evaluate
the Picture Changes with viewing angle for each TV we will compare their
picture and performance seen from a 45°
viewing angle position to their picture and performance seen from the ideal 0° Sweet Spot. For all the tests we used the most color
accurate Picture Mode for each TV: the Cinema mode for the LG TV and the Movie
mode for the Samsung TV.
We’ll start
with Screen Shots of the two TVs to visually demonstrate the changes and
differences with viewing angle. Then we’ll provide the results of our series of
in-depth Lab tests and measurements with a Spectroradiometer to quantitatively
analyze the changes and differences in both color and contrast with viewing
angle.
TV Screen Shots with Viewing Angle
The photos
below are screen shots of both TVs taken at 0° and 45° for visually comparing the picture
changes with viewing angle.
For the 45° side viewing angle, the keystone geometric distortion
that is normally seen from that position has been removed to make the
comparison with 0° more straight forward. The photos
below are from the DisplayMate
Multimedia with Test Photos Edition.
Referring
to Figure 1 below, from the 0° Viewing Angle Sweet Spot viewing
position the Screen Shots for both TVs look quite similar, but Not from larger
viewing angle positions:
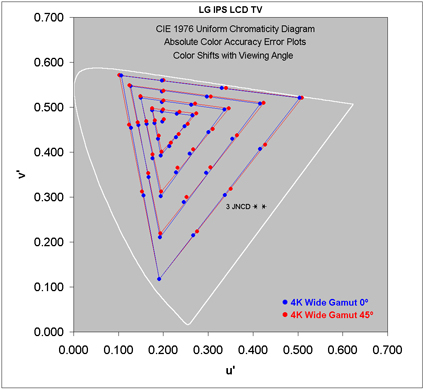
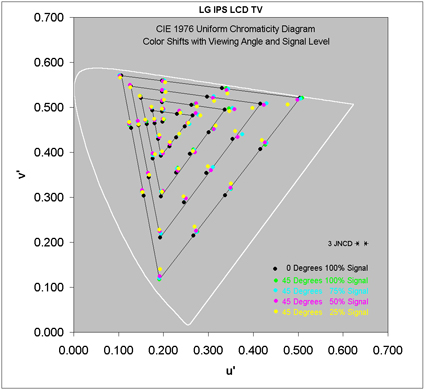
· The LG IPS LCD TV shows only small and barely
noticeable Color Shifts and changes between the 0° and 45° viewing angle positions.
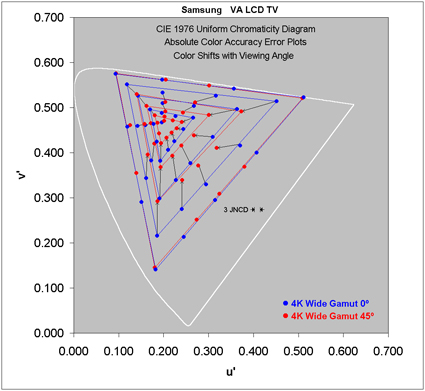
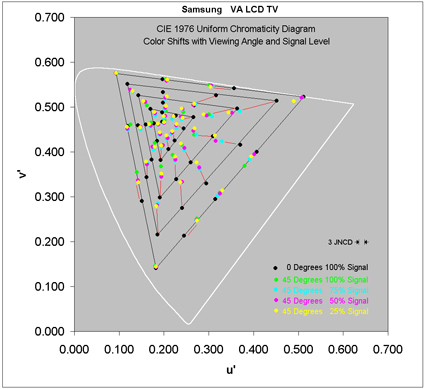
· The Samsung VA LCD TV shows relatively large changes
in hue, saturation, and image contrast between the 0° and 45°
viewing angle positions. The colors and contrast are noticeably weaker and
washed out from the 45°
viewing position.
Figure 1: Screen Shots at
0° and 45° Viewing Angles
|
LG IPS LCD TV
0° Viewing Angle – Exact Center View
|
|
LG IPS LCD TV
45° Viewing Angle – View From the Side
|
|

|
|

|
|
Samsung VA LCD TV
0° Viewing Angle – Exact Center View
|
|
Samsung VA LCD TV
45° Viewing Angle – View from the Side
|
|

|
|

|
|
LG IPS LCD TV
0° Viewing Angle – Exact Center View
|
|
LG IPS LCD TV
45° Viewing Angle – View From the Side
|
|

|
|

|
|
Samsung VA LCD TV
0° Viewing Angle – Exact Center View
|
|
Samsung VA LCD TV
45° Viewing Angle – View from the Side
|
|

|
|

|
Color and Contrast Lab Measurements with Viewing Angle
·
IPS LCD
technology: LG
65SJ9500 Nano Cell 65 inch TV
·
VA LCD
technology: Samsung
65Q8 Quantum Dot 65 inch TV
About the Author
Dr. Raymond Soneira is
President of DisplayMate Technologies Corporation of Amherst, New Hampshire,
which produces display calibration, evaluation, and diagnostic products for
consumers, technicians, and manufacturers. See www.displaymate.com. He is a research
scientist with a career that spans physics, computer science, and television
system design. Dr. Soneira obtained his Ph.D. in Theoretical Physics from
Princeton University, spent 5 years as a Long-Term Member of the world famous
Institute for Advanced Study in Princeton, another 5 years as a Principal
Investigator in the Computer Systems Research Laboratory at AT&T Bell
Laboratories, and has also designed, tested, and installed color television
broadcast equipment for the CBS Television Network Engineering and Development
Department. He has authored over 35 research articles in scientific journals in
physics and computer science, including Scientific American. If you have any
comments or questions about the article, you can contact him at dtso.info@displaymate.com.
DisplayMate Display Optimization Technology
All
displays can be significantly improved using DisplayMate’s proprietary very
advanced scientific analysis and mathematical display modeling and optimization
of the display hardware, factory calibration, and driver parameters. We help
manufacturers with expert display procurement, prototype development, display
performance improvement and optimization, testing displays to meet contract
specifications, and production quality control so that they don’t make mistakes
similar to those that are exposed in our public Display Technology Shoot-Out
series for consumers. This article is a lite version of our advanced scientific
analysis – before the benefits of our DisplayMate Display Optimization
Technology, which can correct or improve all of these issues. If you are a
display or product manufacturer and want to significantly improve display
performance for a competitive advantage then Contact DisplayMate Technologies.
About DisplayMate Technologies
DisplayMate Technologies specializes in proprietary advanced
scientific display calibration and mathematical display optimization to deliver
unsurpassed objective performance, picture quality and accuracy for all types
of displays including video and computer monitors, projectors, TVs, mobile
displays such as Smartphones and Tablets, and all display technologies
including LCD, OLED, 3D, LED, LCoS, Plasma, DLP and CRT. This article is a lite version of
our intensive scientific analysis of TV and Smartphone displays – before the benefits
of our advanced mathematical DisplayMate
Display Optimization Technology, which can correct or improve many of the
display deficiencies. We
offer DisplayMate display calibration software for consumers and advanced
DisplayMate display diagnostic and calibration software for technicians and
test labs.
For
manufacturers we offer Consulting Services that include advanced Lab testing
and evaluations, confidential Shoot-Outs with competing products, calibration
and optimization for displays, cameras and their User Interface, plus on-site
and factory visits. We help manufacturers with expert display procurement,
prototype development, and production quality control so they don’t make
mistakes similar to those that are exposed in our Display Technology Shoot-Out
series. See our world renown Display
Technology Shoot-Out public article series for an introduction and preview.
DisplayMate’s
advanced scientific optimizations can make lower cost panels look as good or
better than more expensive higher performance displays. If you are a display or
product manufacturer and want to turn your display into a spectacular one to
surpass your competition then Contact
DisplayMate Technologies to learn more.
Article Links: Display
Color Gamuts Shoot-Out NTSC to Rec.2020
Copyright © 1990-2017 by DisplayMate
Technologies Corporation. All Rights Reserved.
This article, or any part
thereof, may not be copied, reproduced, mirrored, distributed or incorporated
into any other work without
the prior written permission of DisplayMate Technologies Corporation